
概述
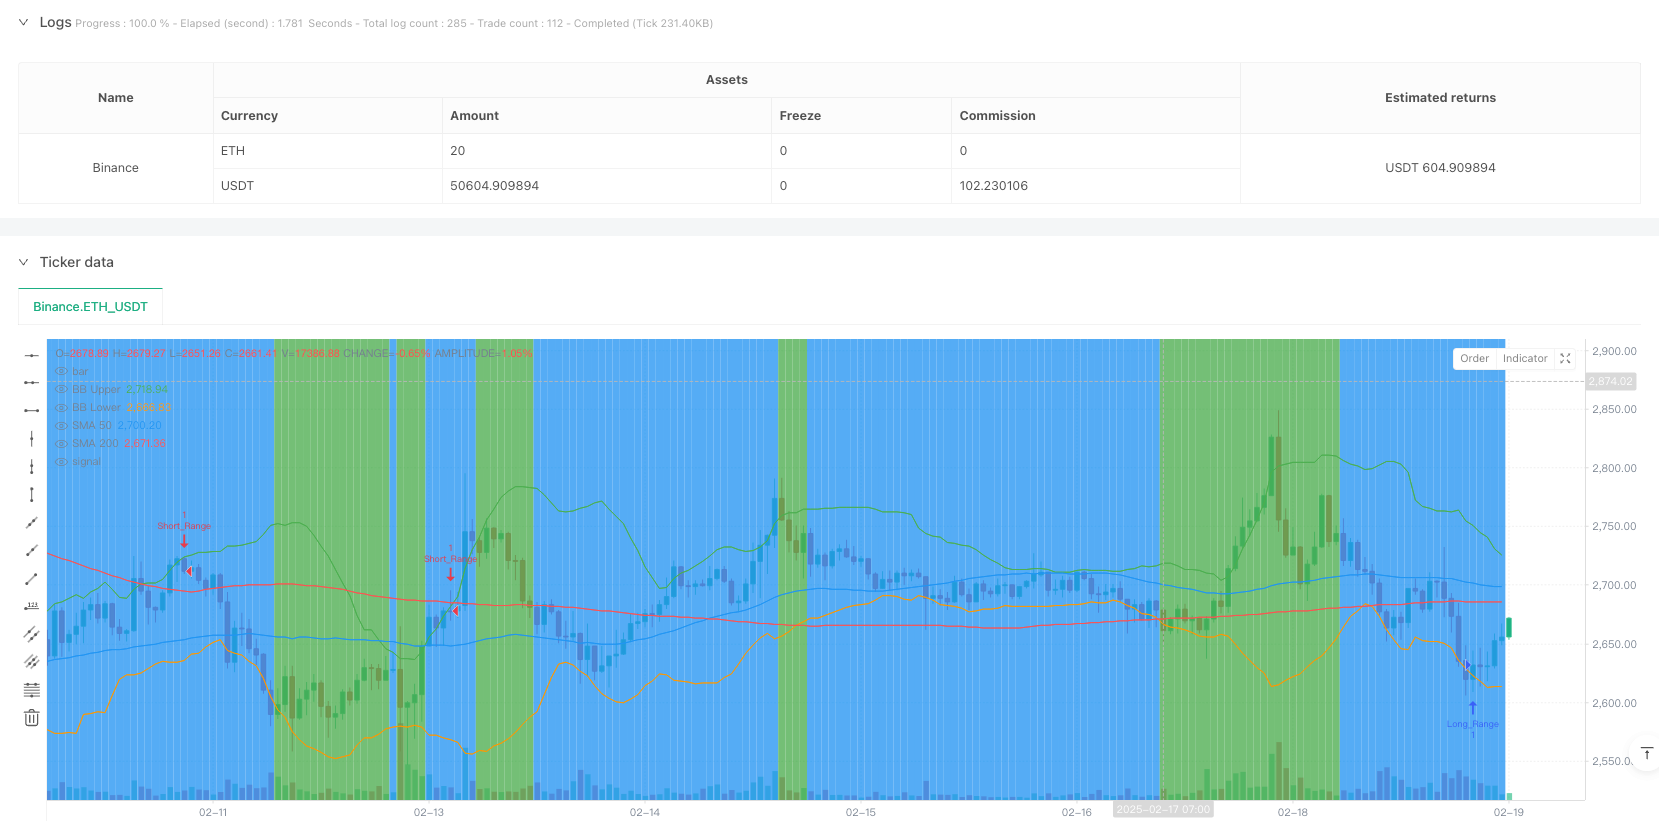
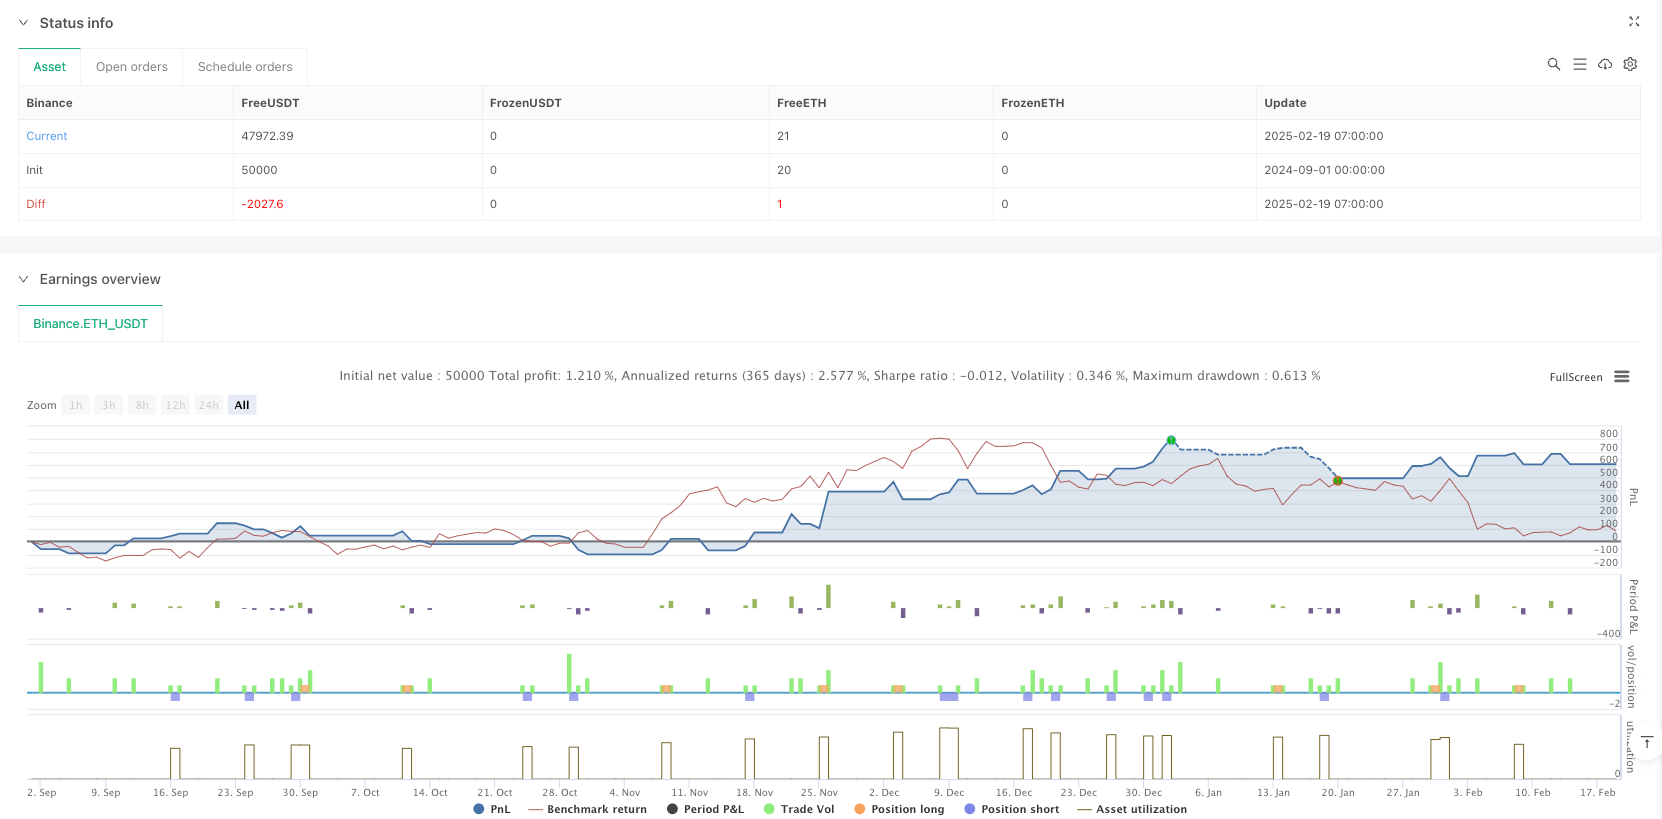
该策略是一个结合了趋势跟踪和区间交易的自适应交易系统。系统通过ADX指标动态识别市场状态,在趋势市场和震荡市场中分别采用不同的交易策略。在趋势市场中,策略使用移动平均线交叉信号结合RSI和MACD确认;在震荡市场中,策略利用布林带突破结合RSI超买超卖信号进行交易。系统还集成了基于ATR的动态止损止盈机制,有效控制风险。
策略原理
策略的核心是市场状态识别机制。当ADX大于25时判定为趋势市场,此时启用趋势跟踪策略: 1. 多头条件:50日均线上穿200日均线,同时RSI大于50且MACD线在信号线上方 2. 空头条件:50日均线下穿200日均线,同时RSI小于50且MACD线在信号线下方
当ADX小于等于25时判定为震荡市场,启用区间交易策略: 1. 多头条件:价格上穿布林带下轨且RSI小于40 2. 空头条件:价格下穿布林带上轨且RSI大于60
止损止盈设置采用ATR的动态倍数方式,止损为1.5倍ATR,止盈为3倍ATR。
策略优势
- 市场适应性强:能够根据市场状态自动切换交易策略
- 多重信号确认:通过多个技术指标的配合降低虚假信号
- 风险控制完善:采用动态止损止盈机制,适应市场波动
- 策略逻辑清晰:趋势和区间判断标准明确,便于优化调整
- 可视化效果好:通过背景颜色区分市场状态,直观明了
策略风险
- 信号滞后性:移动平均线等指标具有一定滞后性,可能错过最佳入场点
- 假突破风险:在震荡市场中可能出现布林带假突破信号
- 参数敏感性:ADX阈值、ATR倍数等参数设置会影响策略表现
- 市场切换风险:在趋势与震荡的过渡期可能产生错误信号
- 止损幅度风险:固定倍数的ATR止损可能在高波动时期过大
策略优化方向
- 引入成交量分析:在信号确认中加入成交量因素,提高信号可靠性
- 优化市场状态判断:可考虑将ADX改为动态阈值或结合其他指标
- 完善止损机制:引入跟踪止损或根据波动率动态调整ATR倍数
- 增加时间过滤:加入交易时间段限制,避开低流动性期间
- 改进信号确认机制:可以考虑加入价格形态分析,提高信号质量
总结
该策略通过市场状态的动态识别和相应的策略切换,实现了对不同市场环境的适应。通过多重技术指标的配合和动态风险控制机制,策略具有较好的实用性。但仍需注意信号滞后性和假突破等风险,建议在实盘中进行充分测试和参数优化。
策略源码
/*backtest
start: 2024-09-01 00:00:00
end: 2025-02-19 08:00:00
period: 1h
basePeriod: 1h
exchanges: [{"eid":"Binance","currency":"ETH_USDT"}]
*/

//@version=6
strategy("Trend vs Range Trading - Fully Fixed for v6", overlay=true)

// 🔹 Moving Averages (SMA 50 & 200)
sma50 = ta.sma(close, 50)
sma200 = ta.sma(close, 200)

// 🔹 Proper ADX Calculation (With Corrected ta.dmi() Parameters)
dmiLength = 14
adxSmoothing = 14
[dmiPlus, dmiMinus, adx] = ta.dmi(dmiLength, adxSmoothing)

// 🔹 Bollinger Bands Calculation (Fixed for v6)
bb_length = 20
bb_mult = 2.0
bb_basis = ta.sma(close, bb_length)
bb_dev = ta.stdev(close, bb_length)
bb_upper = bb_basis + (bb_mult * bb_dev)
bb_lower = bb_basis - (bb_mult * bb_dev)

// 🔹 Additional Indicators (RSI & MACD)
rsi = ta.rsi(close, 14)
[macdLine, signalLine, _] = ta.macd(close, 12, 26, 9)

// 🔹 ATR for Stop Loss & Take Profit
atr = ta.atr(14)
stop_loss_mult = 1.5  // Stop Loss Multiplier
take_profit_mult = 3.0  // Take Profit Multiplier

// 🔹 Trend vs Range Market Detection
is_trending = adx > 25

// 🔹 Trend Following Strategy (SMA Cross & Confirmation)
long_condition_trend = is_trending and ta.crossover(sma50, sma200) and rsi > 50 and macdLine > signalLine
short_condition_trend = is_trending and ta.crossunder(sma50, sma200) and rsi < 50 and macdLine < signalLine

// 🔹 Range Trading Strategy (Bollinger Bands & RSI Confirmation)
long_condition_range = not is_trending and ta.crossover(close, bb_lower) and rsi < 40
short_condition_range = not is_trending and ta.crossunder(close, bb_upper) and rsi > 60

// 🔹 Stop Loss & Take Profit Calculations
long_stop_loss = close - (atr * stop_loss_mult)
long_take_profit = close + (atr * take_profit_mult)
short_stop_loss = close + (atr * stop_loss_mult)
short_take_profit = close - (atr * take_profit_mult)

// 🔹 Execute Trades (With Stop Loss & Take Profit)
if long_condition_trend
    strategy.entry("Long_Trend", strategy.long)
    strategy.exit("Exit_Long_Trend", from_entry="Long_Trend", stop=long_stop_loss, limit=long_take_profit)

if short_condition_trend
    strategy.entry("Short_Trend", strategy.short)
    strategy.exit("Exit_Short_Trend", from_entry="Short_Trend", stop=short_stop_loss, limit=short_take_profit)

if long_condition_range
    strategy.entry("Long_Range", strategy.long)
    strategy.exit("Exit_Long_Range", from_entry="Long_Range", stop=long_stop_loss, limit=long_take_profit)

if short_condition_range
    strategy.entry("Short_Range", strategy.short)
    strategy.exit("Exit_Short_Range", from_entry="Short_Range", stop=short_stop_loss, limit=short_take_profit)

// 🔹 Visual Indicators & Background Color (Trend vs Range)
bgcolor(is_trending ? color.green : color.blue)

// 🔹 Plot Moving Averages & Bollinger Bands
plot(sma50, color=color.blue, title="SMA 50")
plot(sma200, color=color.red, title="SMA 200")
plot(bb_upper, color=color.green, title="BB Upper")
plot(bb_lower, color=color.orange, title="BB Lower")
相关推荐