Multi-Period Donchian Channel Trend Following and Divergence Trading Strategy

Overview
This strategy builds a trend following system based on multi-period Donchian Channels. By analyzing Donchian Channel breakouts across different timeframes and combining main and local trend relationships, it forms an visually intuitive trend ribbon. The strategy uses varying color depths to display trend strength, with green representing uptrends and red representing downtrends, where deeper colors indicate more pronounced trends.
Strategy Principles
The core of the strategy is trend determination based on the Donchian Channel indicator. The Donchian Channel consists of upper and lower bands, determining trends by comparing current price position relative to the channel. Key components include:
- Main trend determination: Using 20-period Donchian Channel, uptrend forms when price breaks above upper band, downtrend forms when breaking below lower band
- Local trend determination: Under the main trend framework, shorter period Donchian Channels determine local trend direction
- Trend ribbon: Combination of 10 different period Donchian Channels forms a trend ribbon, with color depth reflecting trend strength
- Trading signals: Long entries on uptrend, short entries on downtrend, positions closed on trend reversal
Strategy Advantages
- Objective trend determination: Based on price breakouts, avoiding subjective judgment bias
- Multi-period confirmation: Improves trend determination accuracy through multiple timeframe trend overlay
- Intuitive visualization: Trend ribbon color changes clearly display market conditions
- Clear trading rules: Entry and exit signals are well-defined for programmatic implementation
- High adaptability: Parameters can be adjusted to optimize strategy performance for different instruments
Strategy Risks
- Trend reversal risk: Significant drawdowns possible at trend turning points
- Unsuitable for ranging markets: False signals likely during sideways consolidation
- Parameter sensitivity: Different parameter settings significantly affect strategy performance
- Slippage impact: Frequent trading may be affected by slippage
- Systematic risk: Market events may cause major losses
Strategy Optimization Directions
- Add trend strength filtering: Incorporate ADX and other trend strength indicators to filter weak trend signals
- Optimize stop loss settings: Dynamically adjust stop loss positions based on ATR for better risk control
- Add volume confirmation: Incorporate volume analysis to verify trend validity
- Introduce volatility adaptation: Dynamically adjust parameters based on market volatility
- Improve position management: Dynamically adjust position size based on trend strength
Summary
This strategy creates a visually striking and logically clear trend following trading system through innovative application of multi-period Donchian Channels. The core advantage lies in visualizing complex trend analysis processes, making it easier for traders to intuitively grasp market trends. Through proper parameter optimization and risk control measures, this strategy has good practical application value. Traders are advised to consider market conditions carefully when implementing live trading and manage positions according to their risk tolerance.
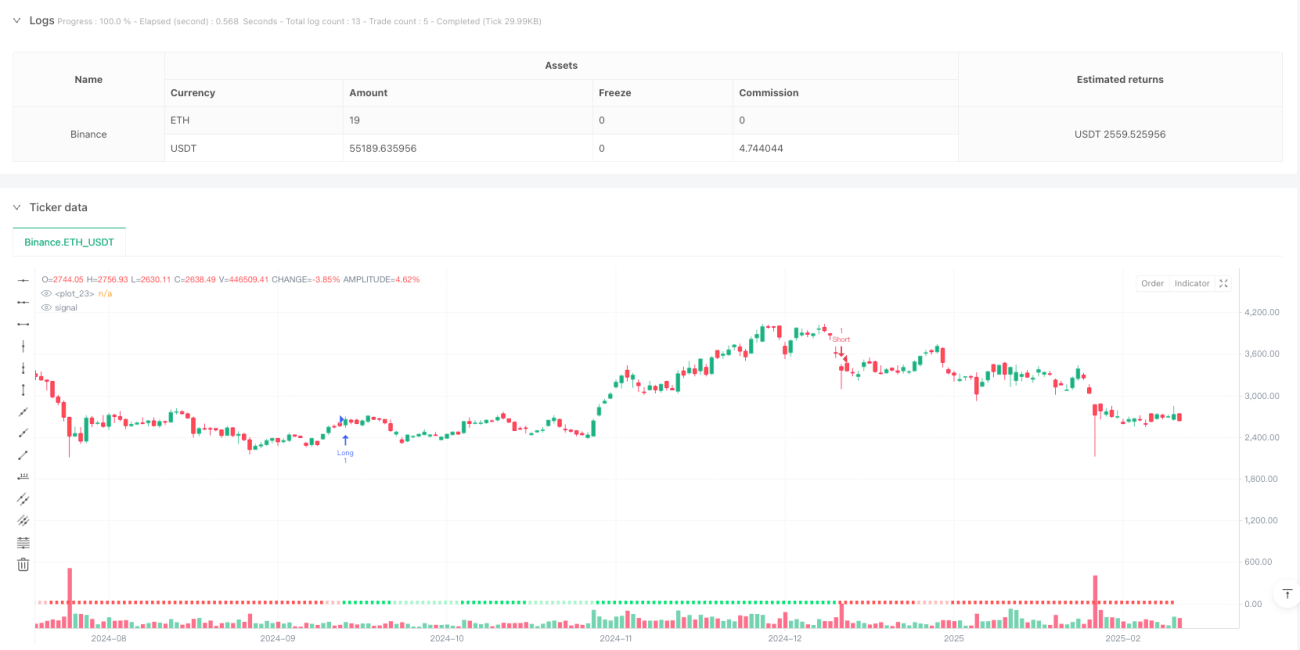
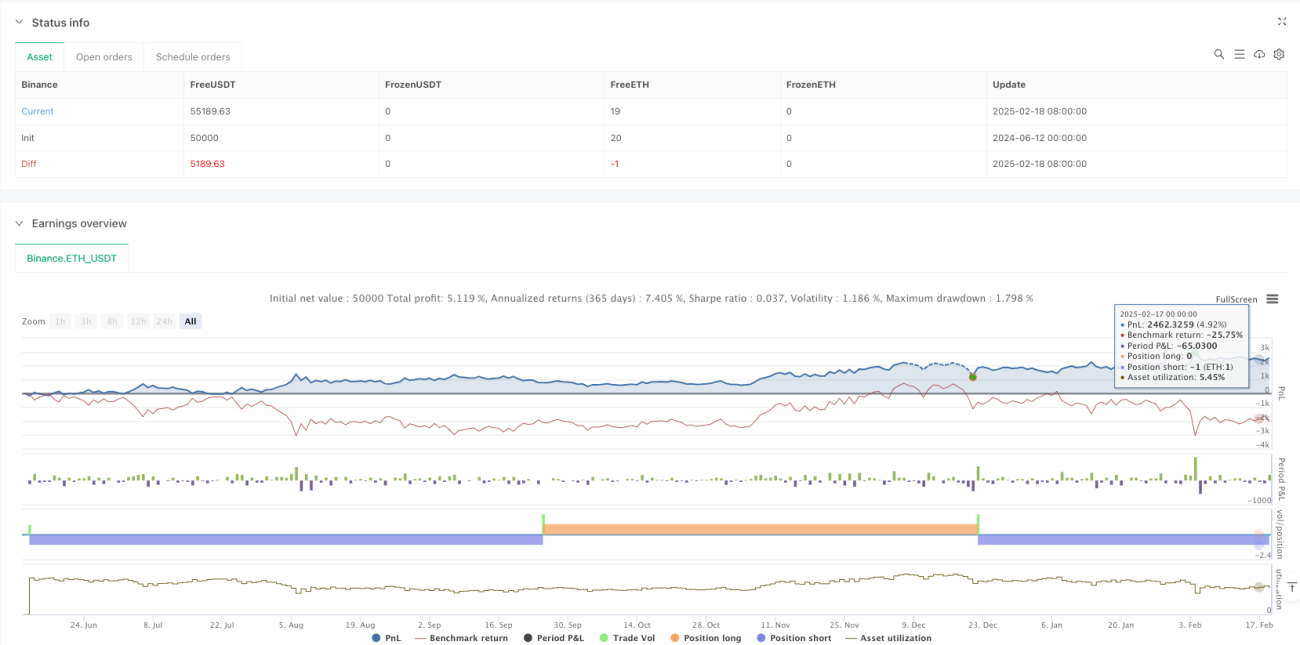
/*backtest
start: 2024-06-12 00:00:00
end: 2025-02-19 08:00:00
period: 1d
basePeriod: 1d
exchanges: [{"eid":"Binance","currency":"ETH_USDT"}]
*/

//@version=6
strategy("Donchian Trend Ribbon Strategy", shorttitle="DonchianTrendRibbonStrat", overlay=true, precision=0)

//~~~~~~~~~~~~~~~~~~~~~~~~~~~~~~~~~~~~~~~~~~~~~~~~~~~~~~~~~~~~~~~~~~~~~~~~~~~~~~- 1