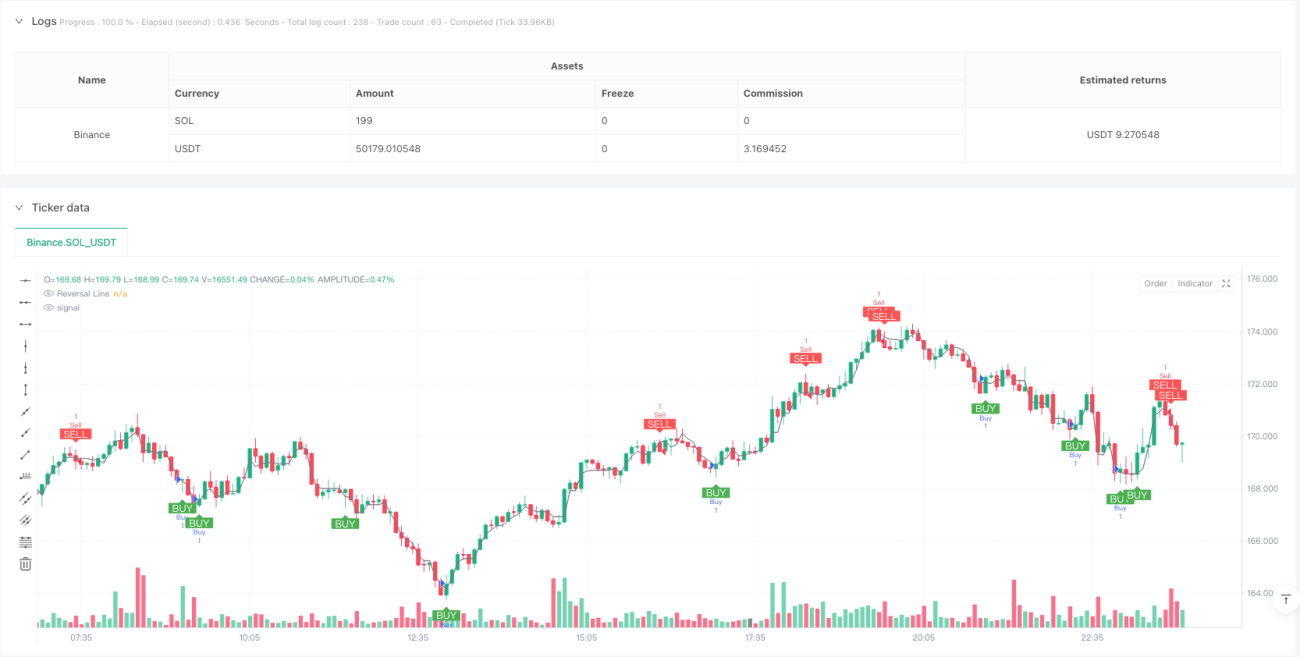
该策略是一个结合了ZigZag百分比回撤和随机指标(Stochastic)的交易系统。策略通过动态调整的ZigZag指标来识别市场趋势的关键转折点,并结合随机指标的超买超卖信号来优化入场时机。系统还整合了止损和止盈机制,以实现风险管理。
策略的核心逻辑基于以下几个关键组件: 1. 动态ZigZag指标 - 支持手动设置或基于不同周期(5-250)的ATR动态调整回撤百分比 2. 随机指标过滤 - 使用9周期K值和3周期平滑的随机指标 3. 交易信号生成: - 买入条件:价格突破反转线且随机指标K值低于20 - 卖出条件:价格跌破反转线且随机指标K值高于80 4. 风险管理 - 采用固定点数的止损(100点)和止盈(300点)
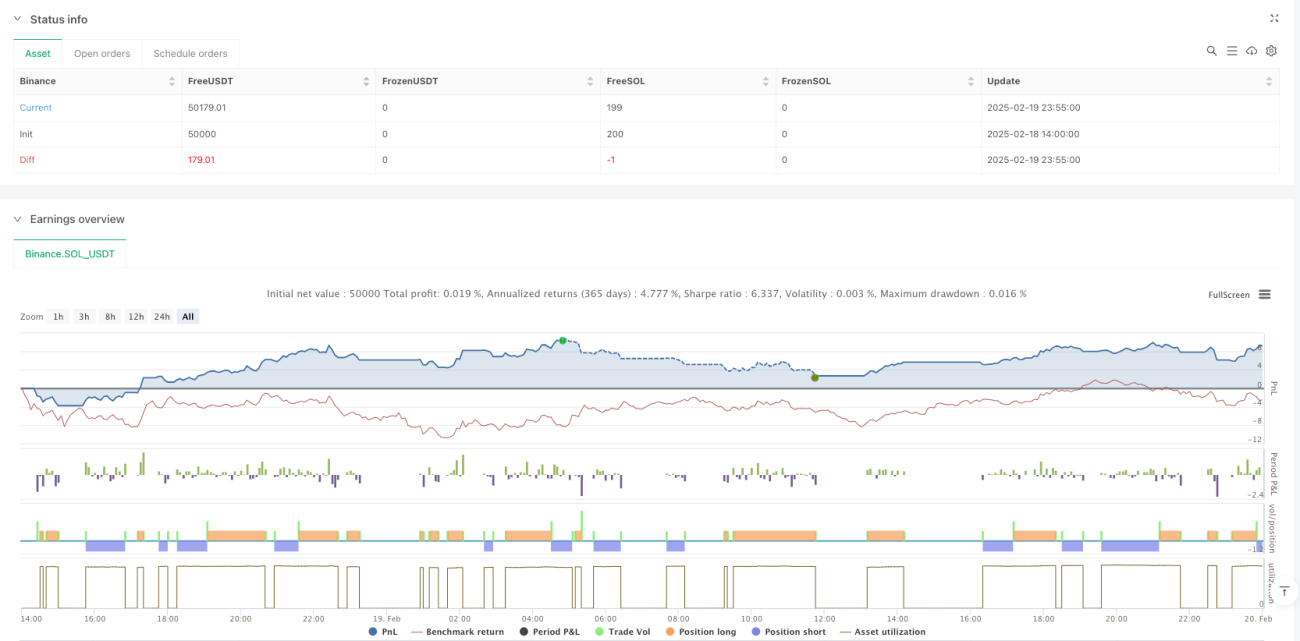
该策略通过结合ZigZag和随机指标,构建了一个较为完整的交易系统。策略的主要特点是信号明确、风险可控,但仍需要根据实际市场情况进行参数优化。建议在实盘交易前进行充分的回测,并结合市场经验对策略进行持续改进。
/*backtest
start: 2025-02-18 14:00:00
end: 2025-02-20 00:00:00
period: 5m
basePeriod: 5m
exchanges: [{"eid":"Binance","currency":"SOL_USDT"}]
*/
//@version=5
strategy("[RS]ZigZag Percent Reversal with Stochastic Strategy", overlay=true)
// ||---}---------------------------------------------------------------------||
// |--------------------------------------------------------------------------||
// | ZigZag: ||
// |--------------------------------------------------------------------------||
// |{
string percent_method = input.string(
defval="MANUAL",
title="Method to use for the zigzag reversal range:",
options=[
"MANUAL",
"ATR005 * X", "ATR010 * X", "ATR020 * X", "ATR050 * X", "ATR100 * X", "ATR250 * X"
]
)
var float percent = input.float(
defval=0.25,
title="Percent of last pivot price for zigzag reversal:",
minval=0.0, maxval=99.0
) / 100
float percent_multiplier = input.float(
defval=1.0,
title="Multiplier to apply to ATR if applicable:"
)
if percent_method == "ATR005 * X"
percent := ta.atr(5) / open * percent_multiplier
if percent_method == "ATR010 * X"
percent := ta.atr(10) / open * percent_multiplier
if percent_method == "ATR020 * X"
percent := ta.atr(20) / open * percent_multiplier
if percent_method == "ATR050 * X"
percent := ta.atr(50) / open * percent_multiplier
if percent_method == "ATR100 * X"
percent := ta.atr(100) / open * percent_multiplier
if percent_method == "ATR250 * X"
percent := ta.atr(250) / open * percent_multiplier
// ||-------------------------------------------------------------------------||
// || zigzag function:
// ||-------------------------------------------------------------------------||
// |{
f_zz(_percent)=>
// direction after last pivot
var bool _is_direction_up = na
// track highest price since last lower pivot
var float _htrack = na
// track lowest price since last higher pivot
var float _ltrack = na
// zigzag variable for plotting
var float _pivot = na
// range needed for reaching reversal threshold
float _reverse_range = 0.0
// real pivot time
var int _real_pivot_time = na
var int _htime = na
var int _ltime = na
// reverse line
var float _reverse_line = na
if bar_index >= 1
if na(_is_direction_up)
_is_direction_up := true
_reverse_range := nz(_pivot[1]) * _percent
if _is_direction_up
_ltrack := na
_ltime := time
if na(_htrack)
if high > high[1]
_htrack := high
_htime := time
else
_htrack := high[1]
_htime := time[1]
else
if high > _htrack
_htrack := high
_htime := time
// Reversal line calculation based on the current candle's closing price
_reverse_line := _htrack - _reverse_range
// If close <= reversal line, mark pivot and reverse direction
if close <= _reverse_line
_pivot := _htrack
_real_pivot_time := _htime
_is_direction_up := false
if not _is_direction_up
_htrack := na
_htime := na
if na(_ltrack)
if low < low[1]
_ltrack := low
_ltime := time
else
_ltrack := low[1]
_ltime := time[1]
else
if low < _ltrack
_ltrack := low
_ltime := time
// Reversal line calculation based on the current candle's closing price
_reverse_line := _ltrack + _reverse_range
// If close >= reversal line, mark pivot and reverse direction
if close >= _reverse_line
_pivot := _ltrack
_real_pivot_time := _ltime
_is_direction_up := true
[_pivot, _is_direction_up, _reverse_line, _real_pivot_time]
[pivot, direction_up, reverse_line, pivot_time] = f_zz(percent)
// Çizim
// Sabit Reversal Line (fiyat seviyesinde sabit)
var float static_reverse_line = na
if (not na(reverse_line))
static_reverse_line := reverse_line
plot(series=static_reverse_line, color=color.gray, style=plot.style_line, title="Reversal Line", trackprice=false)
// ||-------------------------------------------------------------------------||
// || Stochastic: ||
// ||-------------------------------------------------------------------------||
// |{
K_length = 9
K_smoothing = 3
// Stochastic %K hesaplama
stochK = ta.sma(ta.stoch(close, high, low, K_length), K_smoothing)
// ||-------------------------------------------------------------------------||
// || Custom Buy/Sell Signals:
// ||-------------------------------------------------------------------------||
// |{
// Buy sinyali: Fiyat reversal line'ının üstünde ve stochastic K değeri 20'nin altında ise
buy_signal = close > static_reverse_line and stochK < 20
// Sell sinyali: Fiyat reversal line'ının altındaysa ve stochastic K değeri 80'in üstünde ise
sell_signal = close < static_reverse_line and stochK > 80
// Alım ve satım sinyali için strateji girişlerini ekle
long_condition = buy_signal
short_condition = sell_signal
// **Burada Stop Loss ve Take Profit değerleri ayarlandı**
stop_loss_pips = 100 // Stop Loss 10 pip
take_profit_pips = 300 // Take Profit 30 pip
// Stop Loss ve Take Profit seviyeleri hesaplanıyor
long_stop_loss = close - stop_loss_pips * syminfo.mintick
long_take_profit = close + take_profit_pips * syminfo.mintick
short_stop_loss = close + stop_loss_pips * syminfo.mintick
short_take_profit = close - take_profit_pips * syminfo.mintick
// Long stratejisi: Alım sinyali ve stop loss/take profit seviyeleri ile
if long_condition
strategy.entry("Buy", strategy.long, stop=long_stop_loss, limit=long_take_profit)
strategy.exit("Take Profit / Stop Loss", from_entry="Buy", stop=long_stop_loss, limit=long_take_profit)
// Webhook ile alım bildirimi gönder
alert("Buy Signal Triggered!", alert.freq_once_per_bar)
// Short stratejisi: Satım sinyali ve stop loss/take profit seviyeleri ile
if short_condition
strategy.entry("Sell", strategy.short, stop=short_stop_loss, limit=short_take_profit)
strategy.exit("Take Profit / Stop Loss", from_entry="Sell", stop=short_stop_loss, limit=short_take_profit)
// Webhook ile satım bildirimi gönder
alert("Sell Signal Triggered!", alert.freq_once_per_bar)
// Alım sinyali gösterimi
plotshape(series=buy_signal, location=location.belowbar, color=color.green, style=shape.labelup, title="Buy Signal", text="BUY", textcolor=color.white)
// Satım sinyali gösterimi
plotshape(series=sell_signal, location=location.abovebar, color=color.red, style=shape.labeldown, title="Sell Signal", text="SELL", textcolor=color.white)