
Overview
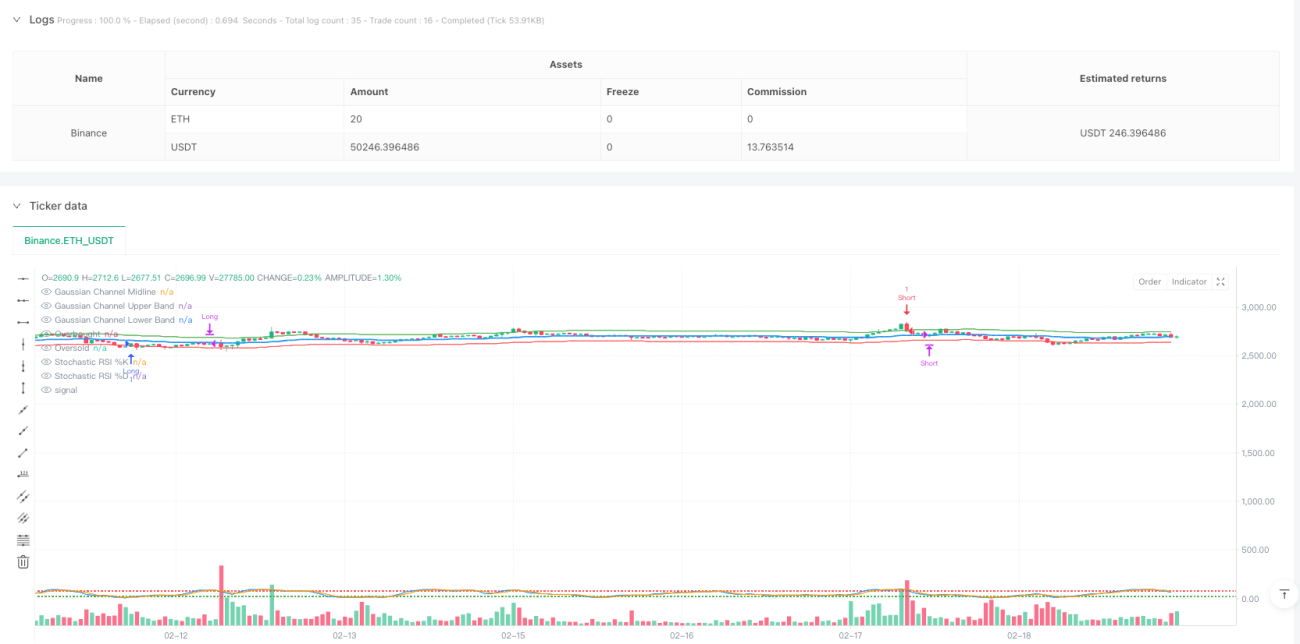
This strategy is a trend-following trading system that combines Gaussian Channel and Stochastic RSI. The Gaussian Channel is used to identify price trends and volatility ranges, while the Stochastic RSI serves as a filter to confirm overbought/oversold conditions, thereby improving the accuracy of trading signals. The strategy generates trading signals by observing price crosses with Gaussian Channel boundaries and Stochastic RSI positions.
Strategy Principle
The core logic of the strategy is based on the following key components:
- Gaussian Channel Calculation: Uses Gaussian filter to calculate the midline and sets channel bands based on multipliers. The Gaussian filter employs exponential smoothing to effectively reduce price noise.
- Stochastic RSI Indicator: Combines the advantages of Stochastic and RSI indicators, using %K and %D smoothed lines to identify overbought/oversold conditions.
- Entry Conditions:
- Long: Price breaks above the lower Gaussian band and Stochastic RSI is in oversold territory
- Short: Price breaks below the upper Gaussian band and Stochastic RSI is in overbought territory
- Exit Conditions:
- When price crosses the Gaussian Channel midline
- Or when Stochastic RSI reaches opposite overbought/oversold levels
Strategy Advantages
- High Signal Reliability: Combines trend and momentum indicators to effectively filter false signals
- Robust Risk Control: Uses Gaussian Channel as dynamic support/resistance levels, providing a solid risk management framework
- Strong Parameter Adaptability: Can adjust channel width and RSI parameters for different market characteristics
- High Computational Efficiency: Gaussian filter requires minimal computation, suitable for real-time trading
- Strong Adaptability: Can be used across different timeframes and market environments
Strategy Risks
- Choppy Market Risk: May generate frequent false breakout signals in sideways markets
- Lag Risk: Indicator smoothing leads to certain signal delays
- Parameter Sensitivity: Different parameter combinations may lead to significantly different trading results
- Market Environment Dependency: Performs well in strong trends but may experience larger drawdowns in quick reversal markets
Strategy Optimization Directions
- Dynamic Parameter Optimization:
- Adapt channel width based on market volatility
- Dynamically adjust Stochastic RSI parameters based on market cycle characteristics
- Signal Confirmation Mechanism:
- Add volume confirmation indicators
- Introduce trend strength filters
- Risk Management Enhancement:
- Implement dynamic stop-loss and take-profit
- Add position management module
- Market Environment Recognition:
- Develop market state classifier
- Adjust strategy parameters based on different market states
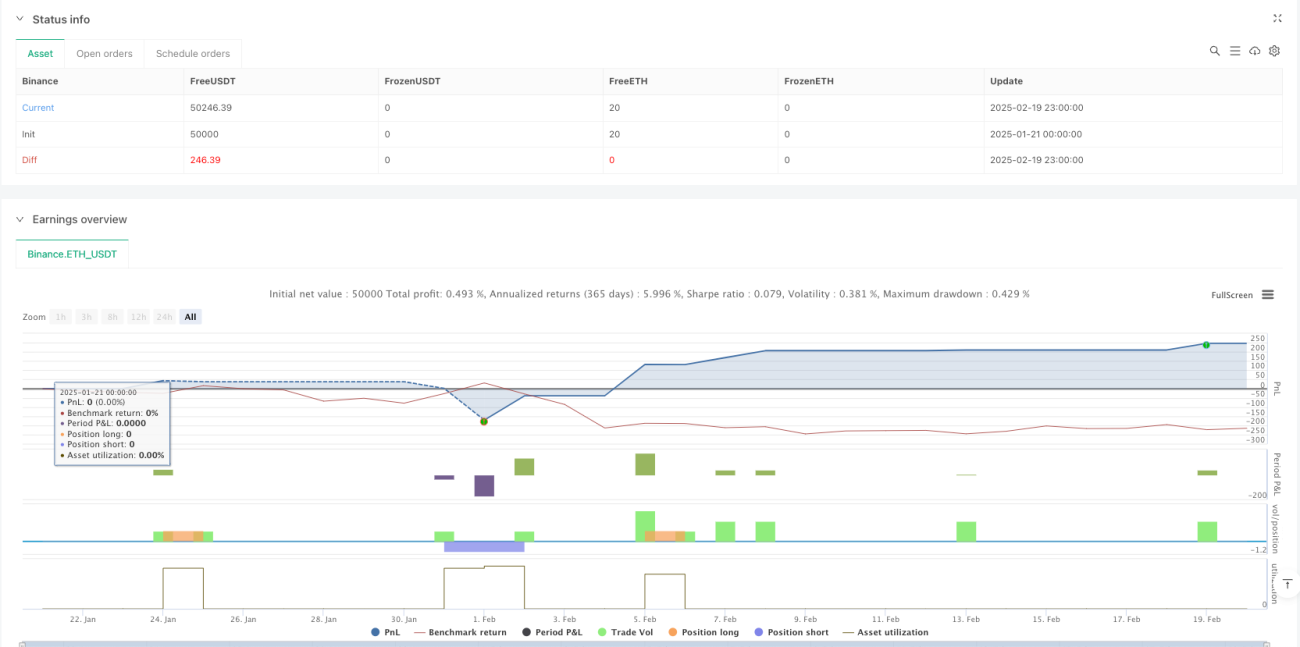
Summary
The strategy builds a trading system combining trend-following and momentum characteristics through the integration of Gaussian Channel and Stochastic RSI. The strategy design is reasonable, with good scalability and adaptability. Through the suggested optimization directions, the strategy's stability and profitability can be further improved. In practical application, it is recommended to thoroughly test different parameter combinations and optimize specifically according to market characteristics.
- 1