
Strategy Overview
This strategy is a trading system based on Inverted Fair Value Gaps (IFVG), combined with trend confirmation and dynamic trailing stop-loss mechanisms. The strategy first identifies Fair Value Gaps (FVG) in the market, then looks for reversal signals of these gaps, while using Simple Moving Averages (SMA) to confirm the overall market trend, and finally implements dynamic trailing stop-losses based on Average True Range (ATR) to optimize risk management. This multi-confirmation mechanism aims to improve the reliability of trading signals while protecting profits through dynamic stop-losses.
Strategy Principles
The core of this strategy is to identify and capitalize on the reversal of Fair Value Gaps (FVG). The strategy principles can be divided into the following key steps:
-
FVG Identification: The strategy first detects Fair Value Gaps, which are price areas formed when the lowest price of a candle is higher than the highest price of the previous candle (bullish FVG) or when the highest price of a candle is lower than the lowest price of the previous candle (bearish FVG). These areas represent price levels that were not traded during rapid market movements.
-
IFVG Confirmation: When price returns to the FVG area and shows a reversal signal, an Inverted Fair Value Gap (IFVG) is formed. Specifically, IFVG is confirmed when the price is higher than the high point of a bullish FVG and the closing price is higher than the opening price, or when the price is lower than the low point of a bearish FVG and the closing price is lower than the opening price.
-
Trend Confirmation: The strategy uses 50-period and 200-period Simple Moving Averages (SMA) to determine market trends. An uptrend is confirmed when the short-term SMA (50-period) is above the long-term SMA (200-period); conversely, a downtrend is confirmed.
-
Entry Conditions:
- Long Condition: When IFVG forms, price is below the IFVG low, and the market is in an uptrend
- Short Condition: When IFVG forms, price is above the IFVG high, and the market is in a downtrend
-
Risk Management:
- Initial stop-loss is set at 0.5% from the entry price
- Take-profit target is set at 1.5% from the entry price
- Dynamic trailing stop-loss is activated when profit reaches half of the take-profit target (0.75%)
- The trailing stop is dynamically adjusted based on ATR(14), ensuring a larger price buffer when market volatility increases
Strategy Advantages
-
Multi-confirmation Mechanism: This strategy combines price structure (IFVG), trend direction (SMA), and dynamic risk management (ATR) to form a multi-layer filtering system, significantly reducing false signals.
-
Market Structure Driven: By identifying FVG and IFVG, the strategy can capture changes in market microstructure, which often represent short-term imbalances in buying and selling forces and potential directional opportunities.
-
Trend Consistency: By confirming the overall trend direction through SMA crossovers, the strategy only trades in the direction of the trend, avoiding the high risk of counter-trend trading.
-
Dynamic Risk Management: The strategy not only sets fixed stop-loss and take-profit levels but also implements ATR-based dynamic trailing stops that adaptively adjust protection levels based on market volatility.
-
Profit Protection Mechanism: When a trade reaches half of the preset profit, the stop-loss automatically moves above the breakeven point, ensuring that trades don't turn from profitable to losing.
-
Timeframe Flexibility: Although backtesting was conducted on a 1-minute timeframe, the core logic of the strategy (FVG, trend confirmation, and dynamic stop-loss) can be applied to various timeframes.
Strategy Risks
-
FVG Reliability Issues: In highly volatile markets, FVGs may appear frequently but not all have trading value, potentially leading to overtrading. The solution is to add additional filtering conditions, such as requiring FVGs to have a minimum width or to form near key price levels.
-
Trend Definition Limitations: Using only two SMAs to define trends may generate false signals in oscillating markets. The solution is to add additional trend confirmation indicators, such as ADX (Average Directional Index) to measure trend strength.
-
Stop-Loss Too Tight Risk: A fixed 0.5% stop-loss may be too tight in some highly volatile instruments and easily triggered by market noise. The solution is to link stop-loss settings with ATR, making them adapt to the volatility characteristics of different instruments.
-
Drawdown Management Insufficiency: When the market suddenly reverses, trailing stops may not respond quickly enough, leading to increased drawdowns. The solution is to set a maximum acceptable drawdown threshold, exiting immediately once exceeded.
-
Parameter Sensitivity: Strategy performance is highly sensitive to parameters such as SMA periods, stop-loss percentages, and ATR multipliers. The solution is to find robust parameter combinations through backtesting optimization and regularly reassess.
Strategy Optimization Directions
-
Multiple Timeframe Analysis Integration: Incorporating FVG and trend information from higher timeframes into the decision-making process can improve signal quality. For example, requiring signals on a 1-minute chart to align with FVG and trend directions on 15-minute or 1-hour charts.
-
Dynamic Take-Profit Mechanism: The current strategy uses a fixed percentage take-profit, which can be improved to an ATR-based dynamic take-profit, or automatically adjust take-profit targets based on market volatility.
-
Adaptability to Reversal and Ranging Markets: Add market environment recognition logic, using the current strategy in clear trend periods and adopting different entry and exit criteria during consolidation periods.
-
Volume Confirmation: Integrate volume analysis to verify the validity of FVG and IFVG. Truly meaningful price gaps are usually accompanied by significant volume changes.
-
Machine Learning Optimization: Use machine learning algorithms to identify the most predictive combination of FVG features, such as gap size, formation speed, relationship with support/resistance, etc.
-
Adaptive Parameter Adjustment: Develop a mechanism that allows the strategy to automatically adjust its parameters based on recent market performance, such as widening stop-loss ranges when volatility increases.
-
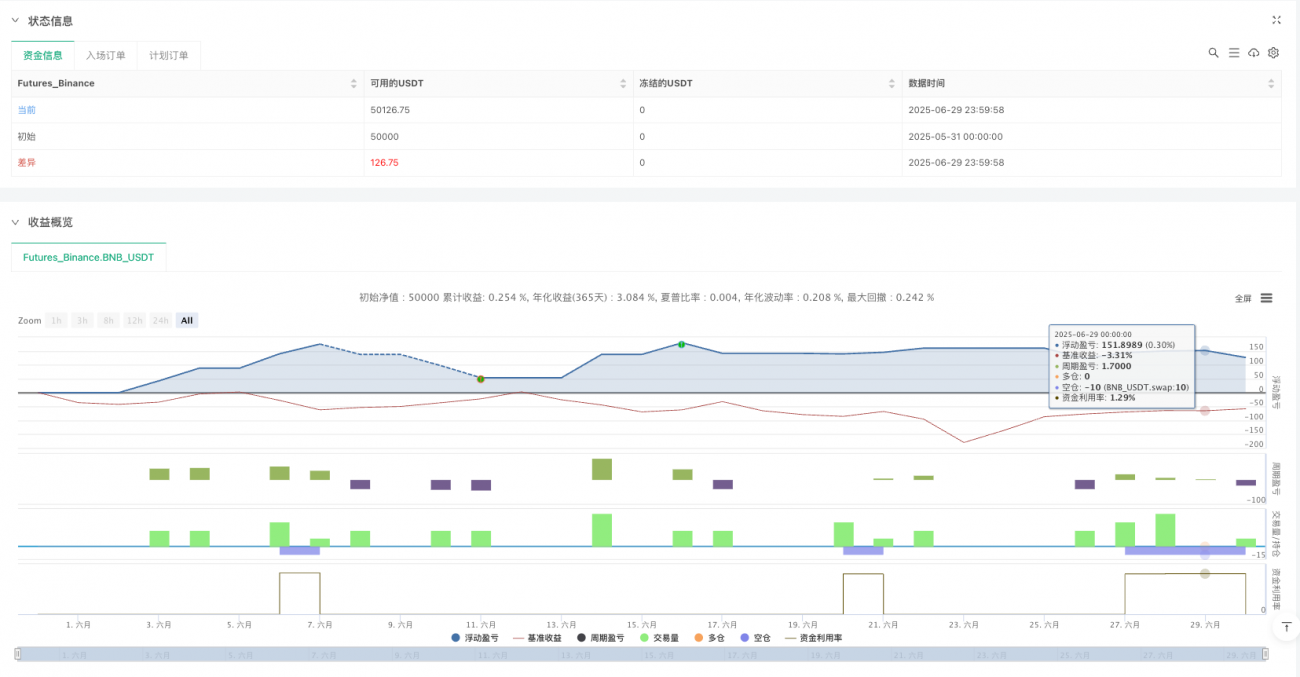
Enhanced Position Management: The current strategy uses a fixed position size (10 units), which can be improved to a dynamic position management system based on volatility and risk metrics, increasing exposure on high-confidence signals and reducing it in uncertain markets.
Summary
The Trend-Confirmed Inverted Fair Value Gap Strategy with Dynamic Trailing Stop-Loss is a multi-layered trading system that organically combines price structure analysis (FVG and IFVG), trend confirmation (SMA), and dynamic risk management (ATR trailing stop-loss). The main advantages of this strategy lie in its multi-confirmation mechanism and adaptive risk management, effectively filtering low-quality signals and protecting realized profits.
However, the strategy also faces challenges such as FVG reliability, trend definition limitations, and parameter sensitivity. Future optimization directions include integrating multiple timeframe analysis, developing dynamic take-profit mechanisms, improving adaptability in different market environments, and introducing machine learning techniques to optimize signal quality and parameter selection.
Through these improvements, the strategy has the potential to develop into a more robust and adaptive trading system capable of maintaining consistent performance under various market conditions. Particularly by enhancing its responsiveness to changes in market structure and volatility, the strategy can better adapt to changing market environments, improving long-term profitability and stability of capital growth.
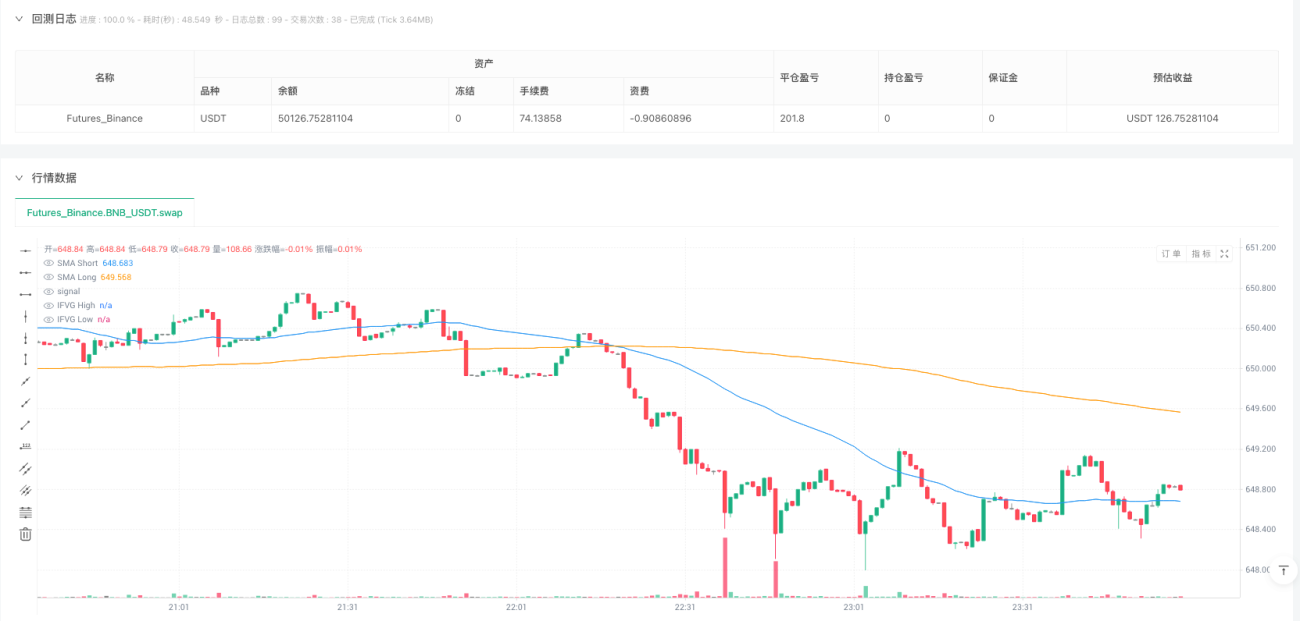
/*backtest
start: 2025-05-31 00:00:00
end: 2025-06-30 00:00:00
period: 1m
basePeriod: 1m
exchanges: [{"eid":"Futures_Binance","currency":"BNB_USDT"}]
args: [["RunMode",1,358374]]
*/

//@version=6
strategy("Inverted FVG Strategy with Trend Check and Trailing Stops", default_qty_value = 10, overlay=true)
- 1