
Overview
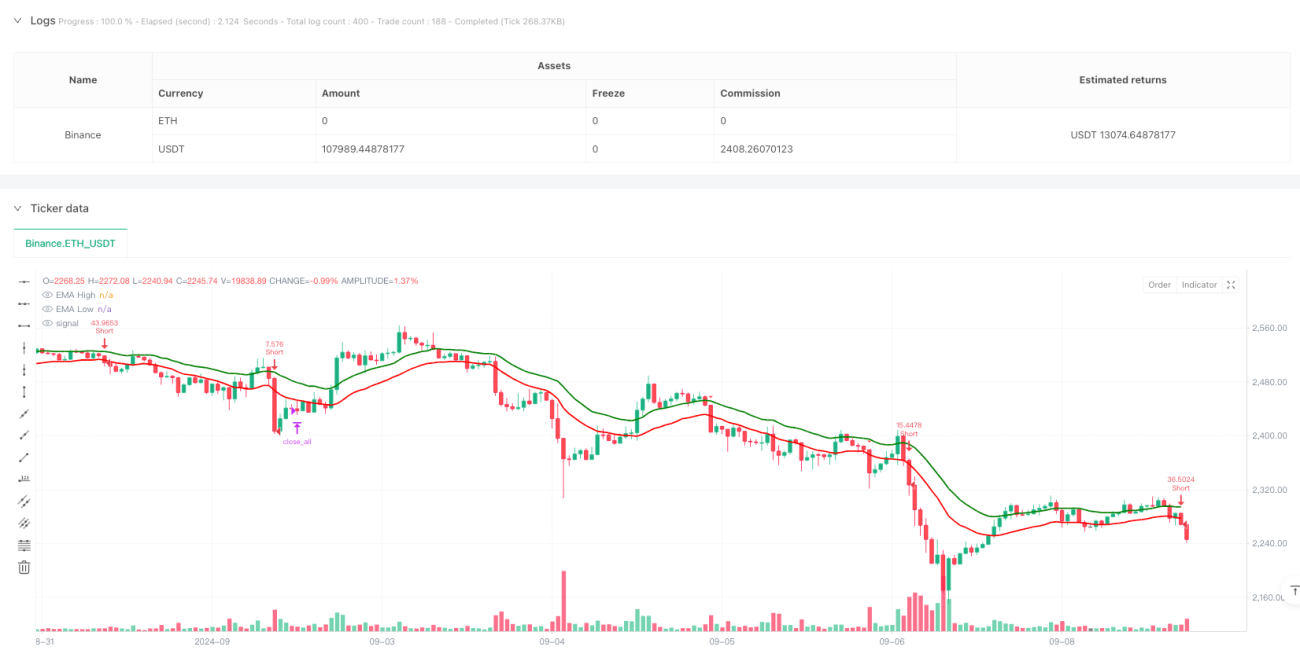
This is an intraday trading strategy based on multiple technical indicators, primarily utilizing EMA channels, RSI overbought/oversold levels, and MACD trend confirmation signals. The strategy operates on a 3-minute timeframe, capturing market trends through EMA high-low channels combined with RSI and MACD crossover confirmations, featuring ATR-based dynamic stop-loss and take-profit levels, and a fixed session closing time.
Strategy Principles
The strategy uses 20-period EMAs on high and low prices to form a channel, entering positions when price breaks the channel and meets the following conditions:
- Long Entry: Close above EMA high, RSI between 50-70, MACD line crosses above signal line
- Short Entry: Close below EMA low, RSI between 30-50, MACD line crosses below signal line
- Uses ATR for dynamic stop-loss calculation, with 2.5:1 risk-reward ratio for take-profit
- Risks 1% of account per trade, with position sizing based on stop-loss distance
- Forces position closure at 15:00 IST
Strategy Advantages
- Multiple technical indicator cross-validation improves signal reliability
- Dynamic stop-loss based on ATR better adapts to market volatility
- Fixed risk percentage and risk-reward ratio for effective risk control
- Considers trading costs with commission calculations
- Prevents pyramiding to avoid excessive position risk
- Fixed closing time eliminates overnight risk
Strategy Risks
- Multiple indicators may lead to delayed signals affecting entry timing
- EMA channels might generate frequent false breakouts in ranging markets
- Fixed risk-reward ratio may lack flexibility in different market conditions
- RSI range restrictions might miss some strong trend movements
- Forced closure at session end may lead to premature exits at critical levels
Strategy Optimization Directions
- Consider adding volume indicators for additional confirmation
- Implement dynamic risk-reward ratios based on different session volatility characteristics
- Introduce volatility-based dynamic RSI thresholds
- Add trend strength filters to reduce false breakouts
- Consider parameter adjustments based on intraday session characteristics
- Incorporate historical volatility analysis for position sizing optimization
Summary
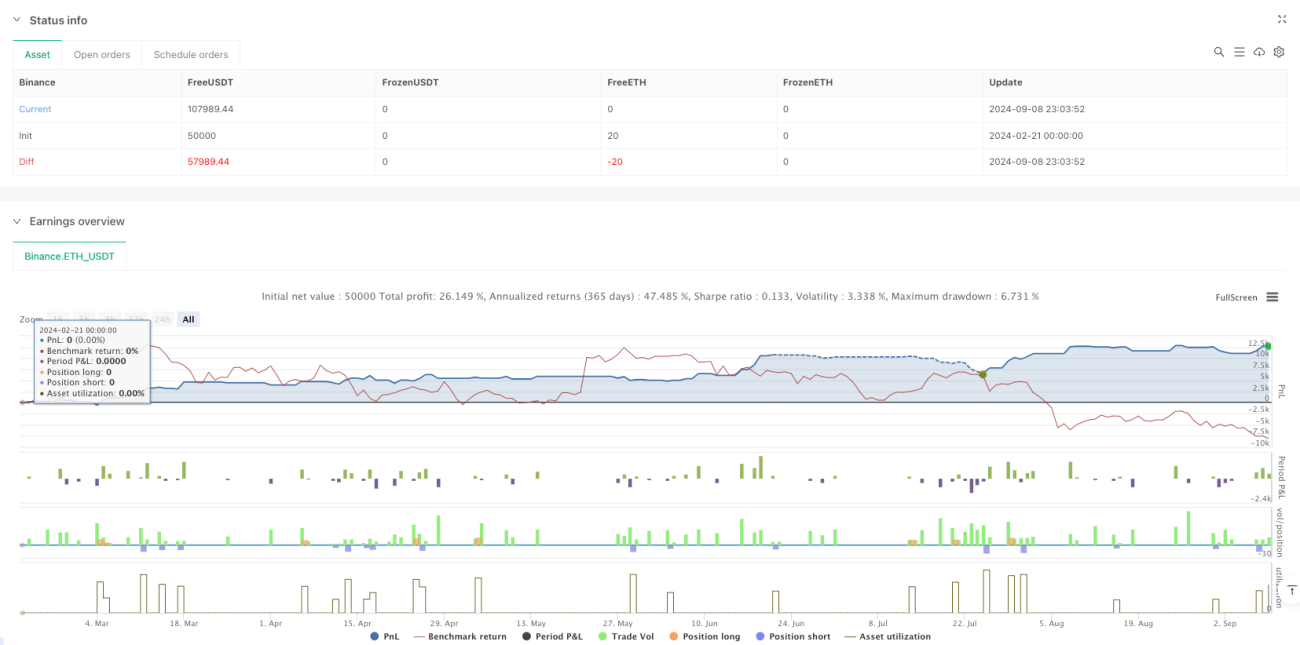
The strategy constructs a relatively complete trading system through the combination of multiple technical indicators. Its strength lies in comprehensive risk control, including dynamic stops, fixed risk parameters, and session-end closure mechanisms. While there are inherent lag risks, performance can be further enhanced through parameter optimization and additional confirmatory indicators. The strategy is particularly suited for volatile intraday markets, achieving stable returns through strict risk control and multiple signal confirmation.
- 1