
概述
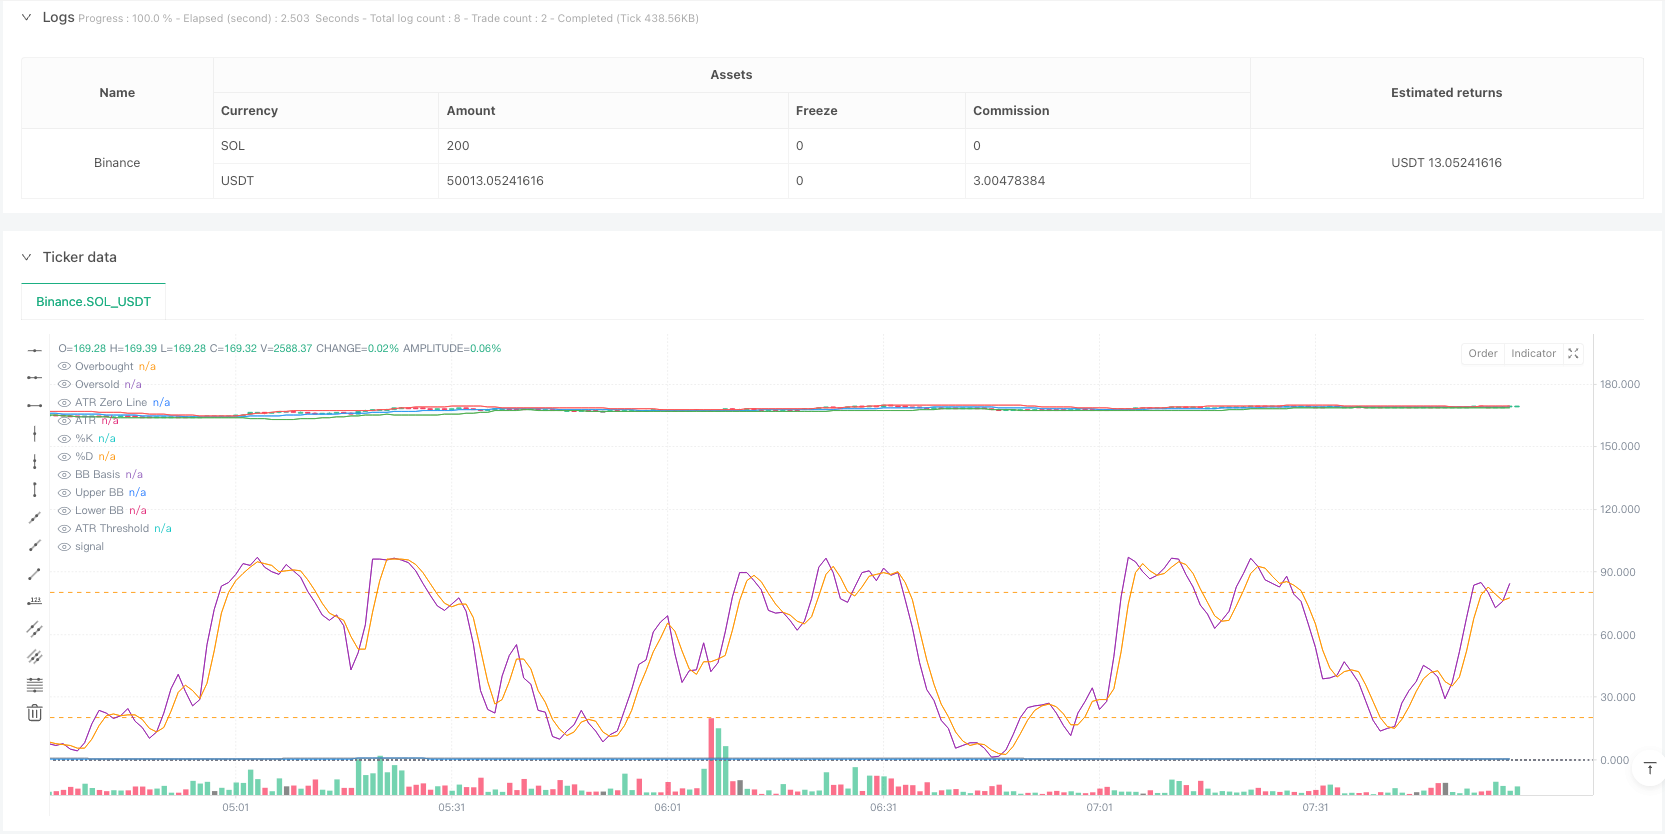
本策略是一个基于多重技术指标的智能交易系统,结合了布林带(Bollinger Bands)、随机指标(Stochastic Oscillator)和平均真实波幅(ATR)三大技术指标,通过对市场波动性、动量和趋势的综合分析来识别潜在的交易机会。该策略采用动态的止损和获利目标设置,能够根据市场波动情况自适应调整交易参数。
策略原理
策略的核心逻辑基于三重验证机制: 1. 使用布林带进行价格波动区间的界定,当价格突破布林带下轨时识别超卖机会,突破上轨时识别超买机会 2. 通过随机指标在超买区(>80)和超卖区(<20)进行动量确认,%K线与%D线的交叉作为入场信号 3. 引入ATR指标作为波动性过滤器,确保在足够的市场波动性支持下进行交易
交易信号的产生需要满足以下条件: 买入条件: - 价格收盘于布林带下轨以下 - 随机指标%K线在超卖区域向上穿越%D线 - ATR值高于设定的阈值,确认足够的市场波动性
卖出条件: - 价格收盘于布林带上轨以上 - 随机指标%K线在超买区域向下穿越%D线 - ATR值维持在阈值以上,确认交易有效性
策略优势
- 多重技术指标交叉验证,显著提高交易信号的可靠性
- 动态的止损和获利目标设置,根据市场波动性自动调整风险管理参数
- 波动性过滤机制有效避免了低波动期间的假信号
- 指标参数可根据不同市场条件灵活调整,具有良好的适应性
- 策略逻辑清晰,易于理解和实施,适合各层次的交易者使用
策略风险
- 在市场剧烈波动时可能出现滑点,影响实际执行价格
- 多重指标的使用可能导致信号滞后,错过最佳入场时机
- 参数优化过度可能导致过拟合,影响策略在实盘中的表现
- 在趋势转折点可能出现虚假信号,需要配合其他分析工具
- 交易成本和佣金可能影响策略的整体收益表现
策略优化方向
- 引入趋势过滤器,如移动平均线交叉系统,以增强趋势确认
- 优化ATR阈值的动态调整机制,使其更好地适应不同市场环境
- 增加成交量指标验证,提高交易信号的可靠性
- 实现自适应参数优化,根据市场状态自动调整指标参数
- 添加时间过滤器,避免在市场波动较大的开盘和收盘时段交易
总结
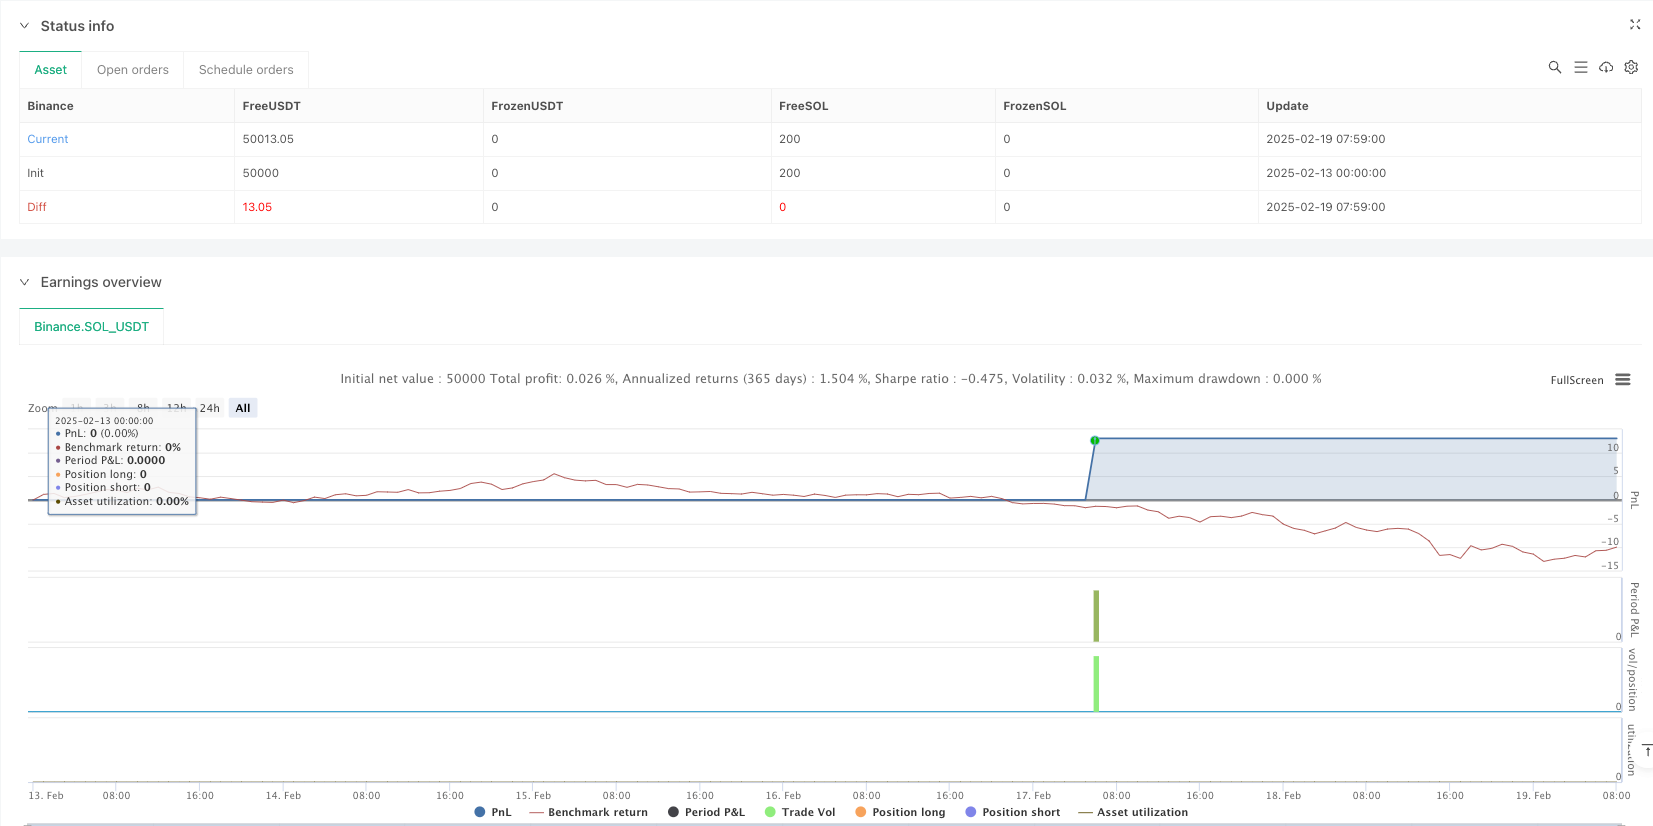
该策略通过布林带、随机指标和ATR的组合应用,构建了一个完整的交易系统。策略的优势在于多重指标的交叉验证和动态风险管理,但同时也需要注意参数优化和市场环境适应性的问题。通过持续优化和完善,该策略有望在实际交易中取得稳定的收益表现。
策略源码
/*backtest
start: 2025-02-13 00:00:00
end: 2025-02-19 08:00:00
period: 1m
basePeriod: 1m
exchanges: [{"eid":"Binance","currency":"SOL_USDT"}]
*/

//@version=5
strategy("Bollinger Bands + Stochastic Oscillator + ATR Strategy", overlay=true, default_qty_type=strategy.percent_of_equity, default_qty_value=10)

// Bollinger Bands Parameters
bb_length = 20
bb_mult = 2.0
basis = ta.sma(close, bb_length)
dev = bb_mult * ta.stdev(close, bb_length)
upper_bb = basis + dev
lower_bb = basis - dev

// Stochastic Oscillator Parameters
stoch_length = 14
k_smooth = 3
d_smooth = 3
stoch_k = ta.sma(ta.stoch(close, high, low, stoch_length), k_smooth)
stoch_d = ta.sma(stoch_k, d_smooth)

// ATR Parameters
atr_length = 14
atr_mult = 1.5
atr = ta.atr(atr_length)

// ATR Threshold based on ATR Moving Average
atr_ma = ta.sma(atr, atr_length)
atr_threshold = atr_ma * atr_mult

// Plot Bollinger Bands
plot(basis, color=color.blue, title="BB Basis")
p1 = plot(upper_bb, color=color.red, title="Upper BB")
p2 = plot(lower_bb, color=color.green, title="Lower BB")
fill(p1, p2, color=color.rgb(173, 216, 230, 90), title="BB Fill")

// Plot Stochastic Oscillator
hline(80, "Overbought", color=color.orange)
hline(20, "Oversold", color=color.orange)
plot(stoch_k, color=color.purple, title="%K")
plot(stoch_d, color=color.orange, title="%D")

// Plot ATR and ATR Threshold for Visualization
hline(0, "ATR Zero Line", color=color.gray, linestyle=hline.style_dotted)
plot(atr, title="ATR", color=color.blue)
plot(atr_threshold, title="ATR Threshold", color=color.gray, style=plot.style_stepline)

// Buy Condition:
// - Price closes below the lower Bollinger Band
// - Stochastic %K crosses above %D in oversold region
// - ATR is above the ATR threshold
buyCondition = close < lower_bb and ta.crossover(stoch_k, stoch_d) and stoch_k < 20 and atr > atr_threshold

// Sell Condition:
// - Price closes above the upper Bollinger Band
// - Stochastic %K crosses below %D in overbought region
// - ATR is above the ATR threshold
sellCondition = close > upper_bb and ta.crossunder(stoch_k, stoch_d) and stoch_k > 80 and atr > atr_threshold

// Plot Buy/Sell Signals
plotshape(series=buyCondition, title="Buy Signal", location=location.belowbar, color=color.green, style=shape.labelup, text="BUY")
plotshape(series=sellCondition, title="Sell Signal", location=location.abovebar, color=color.red, style=shape.labeldown, text="SELL")

// Execute Trades
if (buyCondition)
    strategy.entry("Long", strategy.long)

if (sellCondition)
    strategy.close("Long")

// Optional: Add Stop Loss and Take Profit
// Stop Loss at ATR-based distance
stop_level = close - atr_mult * atr
take_level = close + atr_mult * atr

if (buyCondition)
    strategy.exit("Take Profit/Stop Loss", from_entry="Long", stop=stop_level, limit=take_level)
相关推荐