
Strategy Overview
This strategy is an automated trading system based on multiple Simple Moving Average (SMA) crossovers combined with Relative Strength Index (RSI) signals. It incorporates a multi-validation mechanism using both short-term and medium-term moving averages, confirms trends through RSI indicators, and implements dynamic ATR-based stop losses for risk control, establishing a comprehensive trading decision framework. The strategy primarily aims to capture market trend reversal points while improving trading accuracy through multiple technical indicator confirmations.
Strategy Principles
The core logic is built on five key conditions:
- Price breaks above the 20-period high SMA
- Price breaks above the 20-period low SMA
- Price breaks above the 50-period high SMA
- Price breaks above the 50-period low SMA
- RSI(7) crosses above level 50
A buy signal is generated only when all five conditions are simultaneously satisfied. After entry, the strategy employs dynamic stop-loss and take-profit levels based on ATR, with stop-loss set at 1.5x ATR and take-profit at 2.5x ATR, allowing risk management parameters to automatically adjust based on market volatility.
Strategy Advantages
- The multiple validation mechanism significantly improves the reliability of trading signals by requiring confirmation from multiple technical indicators to reduce false signals.
- The dynamic risk management system automatically adjusts stop-loss and take-profit levels based on market volatility, providing good adaptability.
- Combines trend-following and momentum reversal characteristics, capable of capturing strong breakouts while protecting profits through timely stops.
- Highly adjustable parameters allow traders to modify settings according to different market environments and personal risk preferences.
Strategy Risks
- The requirement for multiple conditions to be simultaneously satisfied may result in missing potential trading opportunities.
- In ranging markets, frequent price crossovers of moving averages may trigger excessive trading signals.
- Fixed ATR multipliers may not be flexible enough under extreme market conditions.
- The strategy doesn't consider fundamental factors, making it potentially vulnerable during significant news events.
Optimization Directions
- Introduce a market volatility filter to adjust trading frequency and position sizing during high volatility periods.
- Add volume confirmation mechanisms to improve breakout signal reliability.
- Develop adaptive ATR multiplier adjustment mechanisms to dynamically modify stop-loss and take-profit levels based on historical volatility.
- Implement trend strength filters to avoid overtrading in weak market conditions.
Conclusion
This is a well-designed technical trading strategy that improves trading accuracy through multiple technical indicator confirmations and employs a dynamic risk management system to protect profits. While the strategy has certain limitations, its performance can be further enhanced through the suggested optimization directions. It is suitable for traders with higher risk tolerance who are willing to engage in long-term strategy optimization.
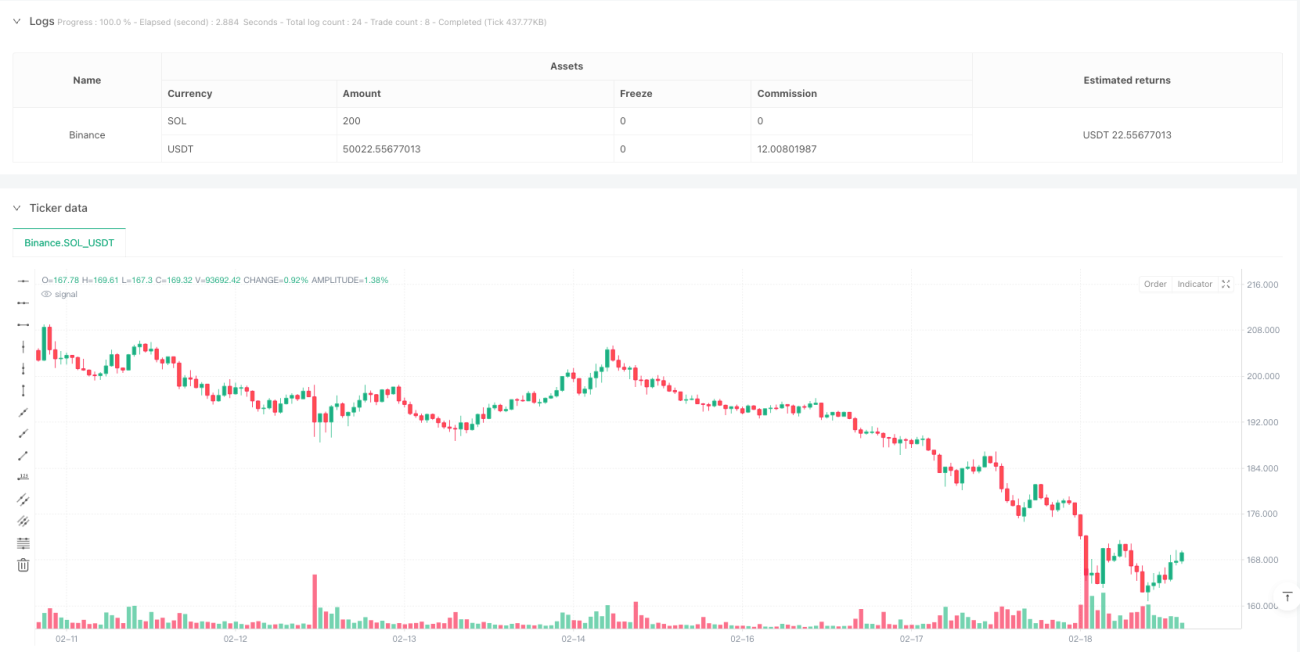
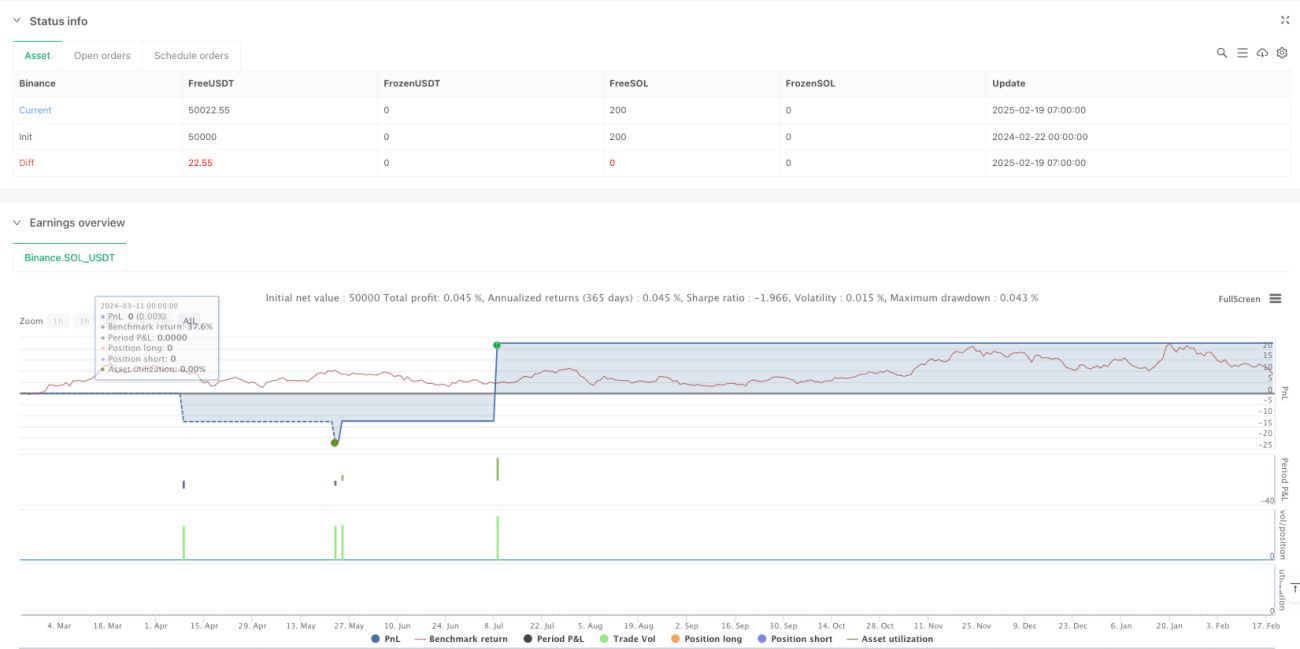
/*backtest
start: 2024-02-22 00:00:00
end: 2025-02-19 08:00:00
period: 1h
basePeriod: 1h
exchanges: [{"eid":"Binance","currency":"SOL_USDT"}]
*/

//@version=5
strategy("Virat Bharat Auto Trade", overlay=true, default_qty_type=strategy.percent_of_equity, default_qty_value=10)

// **User-Defined Inputs for Customization**- 1