
概述
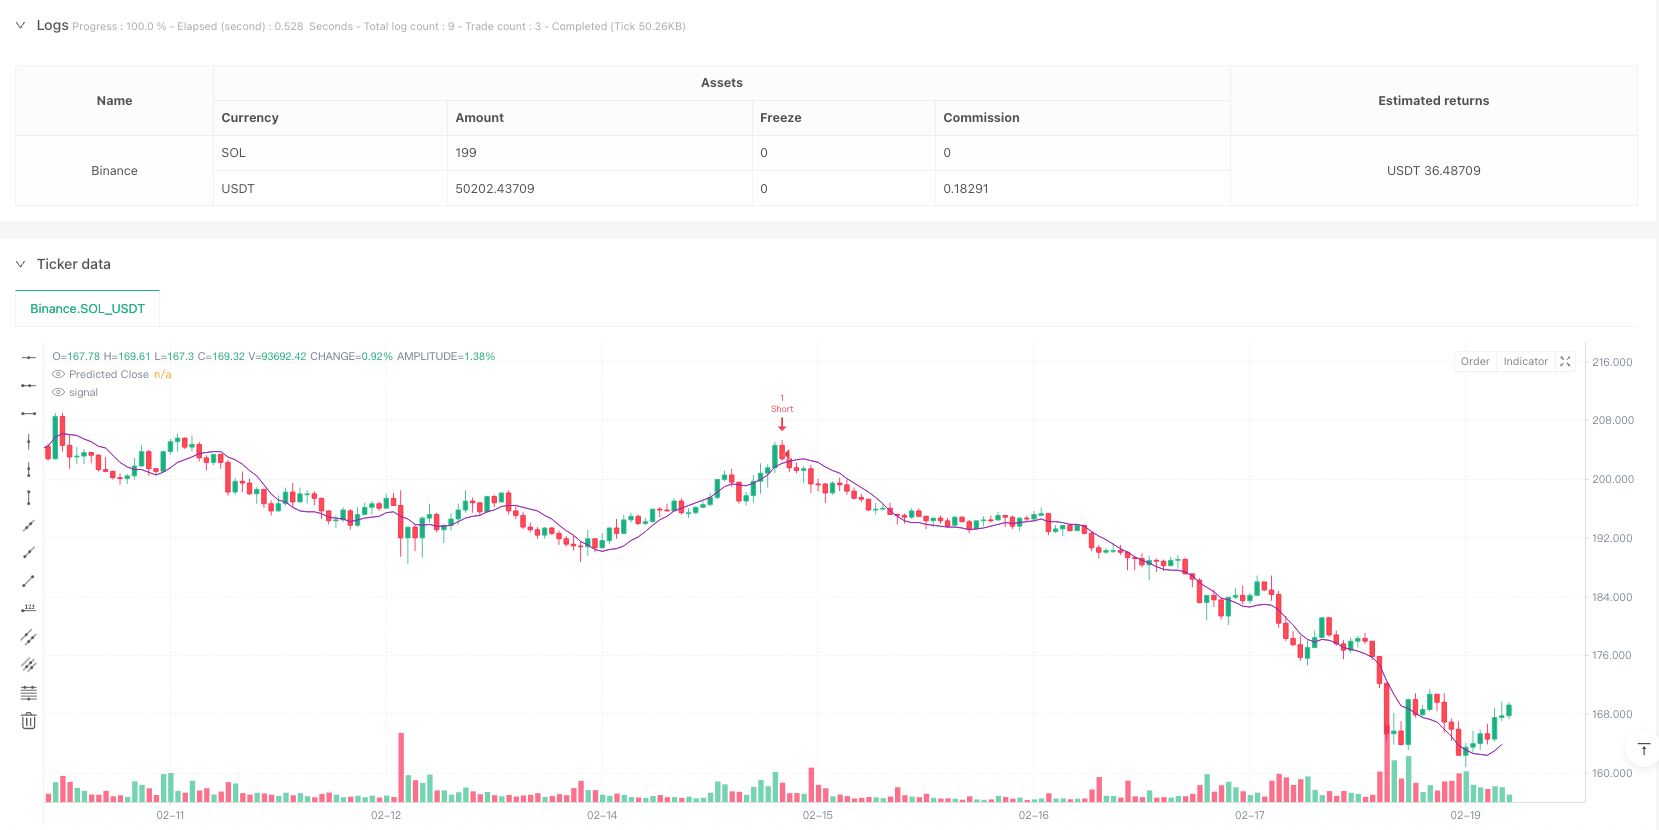
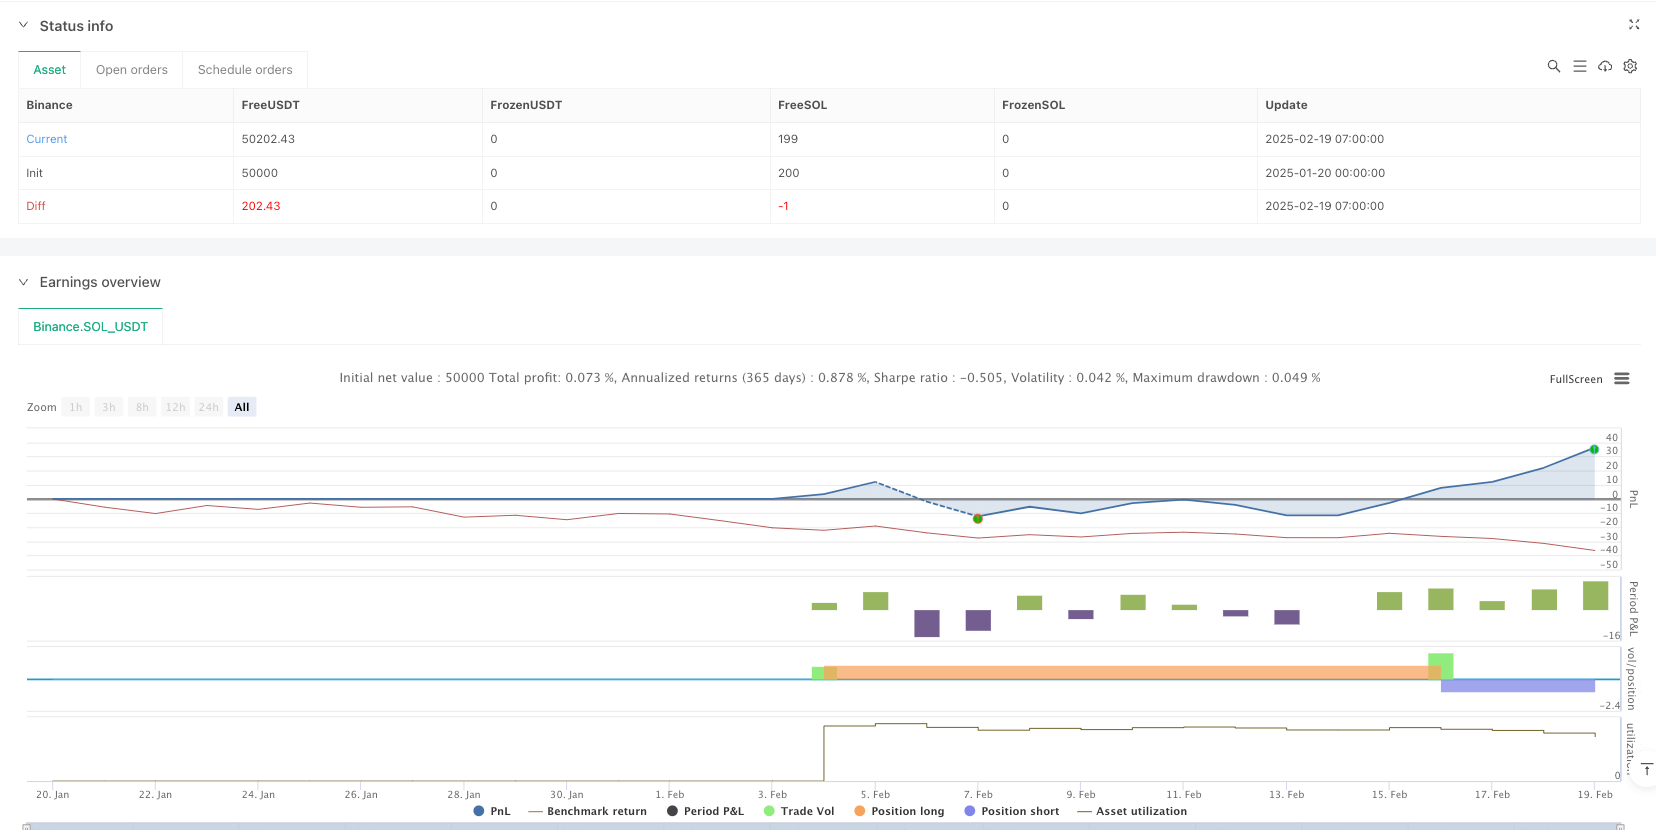
该策略是一个结合了技术指标和机器学习方法的趋势跟踪系统。策略整合了相对强弱指标(RSI)、平均趋向指标(ADX)和线性回归预测模型,通过多维度分析来确定市场趋势和交易机会。该策略在5分钟时间周期运行,通过RSI超买超卖信号、ADX趋势确认和线性回归预测相结合的方式,实现了一个完整的交易决策系统。
策略原理
策略采用三层过滤机制来确定交易信号: 1. RSI指标用于识别超买超卖条件,当RSI突破30(超卖)产生做多信号,突破70(超买)产生做空信号 2. ADX指标用于确认趋势强度,仅在ADX大于25时允许交易,确保在强趋势环境下进行操作 3. 线性回归预测模块通过分析过去20个价格周期的数据,计算价格趋势的斜率和截距,预测下一个价格水平 只有当这三个条件同时满足时(方向一致),策略才会发出交易信号。
策略优势
- 多维度验证: 结合技术指标和统计预测方法,提供更可靠的交易信号
- 趋势确认: 通过ADX过滤确保只在强趋势市场中交易,避免震荡市场的假信号
- 预测能力: 引入线性回归预测模型,能够对价格走势进行前瞻性分析
- 灵活性强: 主要参数都可以根据不同市场条件进行调整
- 执行明确: 交易规则清晰,信号生成条件严格,降低了主观判断的影响
策略风险
- 参数敏感性: 策略效果强烈依赖于RSI、ADX和回归周期的参数设置
- 滞后性风险: 技术指标本身具有一定滞后性,可能导致入场时机略有延迟
- 趋势反转风险: 在趋势突然反转时,可能因为系统反应不及时造成损失
- 过度拟合风险: 线性回归预测可能过度拟合历史数据,影响预测准确性
- 市场条件依赖: 策略在震荡市场中可能表现欠佳
策略优化方向
- 动态参数调整: 引入自适应参数机制,根据市场波动率自动调整RSI和ADX的参数
- 增加市场环境过滤: 添加波动率指标,在不同市场环境下调整策略参数或暂停交易
- 优化预测模型: 考虑使用更复杂的机器学习模型,如LSTM或随机森林,提高预测准确性
- 完善风险管理: 增加动态止损机制,根据市场波动情况调整止损位置
- 增加交易时间过滤: 避开低流动性时段和重要新闻发布时期
总结
该策略通过结合传统技术分析和现代预测方法,构建了一个相对完整的交易系统。策略的核心优势在于多维度的信号确认机制,能够有效降低虚假信号的影响。通过改进预测模型、优化参数调整机制和增强风险管理,策略还有较大的优化空间。在实际应用中,建议投资者根据具体市场特征和自身风险承受能力,对策略参数进行适当调整。
策略源码
/*backtest
start: 2025-01-20 00:00:00
end: 2025-02-19 08:00:00
period: 1h
basePeriod: 1h
exchanges: [{"eid":"Binance","currency":"SOL_USDT"}]
*/

//@version=5
strategy("RSI + ADX + ML-like Strategy (5min)", overlay=true)

// ———— 1. Inputs ————
rsiLength = input(14, "RSI Length")
adxLength = input(14, "ADX Length")
mlLookback = input(20, "ML Lookback (Bars)")

// ———— 2. Calculate Indicators ————
// RSI
rsi = ta.rsi(close, rsiLength)

// ADX
[diPlus, diMinus, adx] = ta.dmi(adxLength, adxLength)

// ———— 3. Simplified ML-like Component (Linear Regression) ————
var float predictedClose = na
sumX = math.sum(bar_index, mlLookback)          // FIXED: Using math.sum()
sumY = math.sum(close, mlLookback)              // FIXED: Using math.sum()
sumXY = math.sum(bar_index * close, mlLookback) // FIXED: Using math.sum()
sumX2 = math.sum(bar_index * bar_index, mlLookback)

slope = (mlLookback * sumXY - sumX * sumY) / (mlLookback * sumX2 - sumX * sumX)
intercept = (sumY - slope * sumX) / mlLookback
predictedClose := slope * bar_index + intercept

// ———— 4. Strategy Logic ————
mlBullish = predictedClose > close
mlBearish = predictedClose < close

enterLong = ta.crossover(rsi, 30) and adx > 25 and mlBullish
enterShort = ta.crossunder(rsi, 70) and adx > 25 and mlBearish

// ———— 5. Execute Orders ————
strategy.entry("Long", strategy.long, when=enterLong)
strategy.entry("Short", strategy.short, when=enterShort)

// ———— 6. Plotting ————
plot(predictedClose, "Predicted Close", color=color.purple)
plotshape(enterLong, "Buy", shape.triangleup, location.belowbar, color=color.green)
plotshape(enterShort, "Sell", shape.triangledown, location.abovebar, color=color.red)
相关推荐