概述
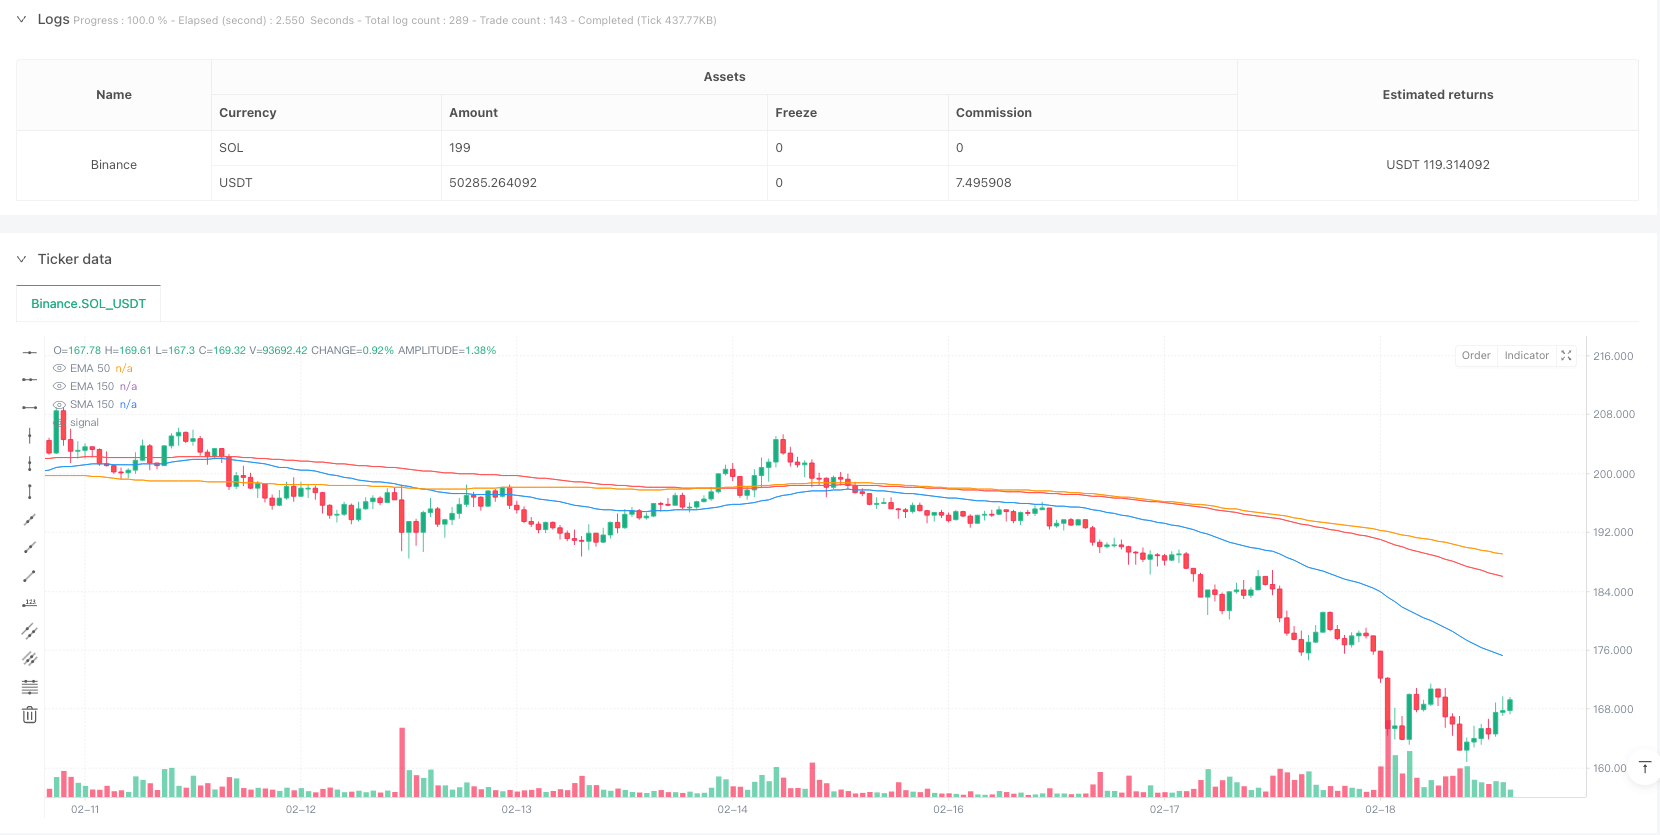
该策略是一个结合了指数移动平均线(EMA)和简单移动平均线(SMA)的趋势跟踪交易系统。策略主要利用EMA50与EMA150的交叉产生交易信号,同时使用SMA150作为止损线,并包含止损后的重入场机制。这种设计既能捕捉中长期趋势,又能有效控制风险。
策略原理
策略的核心逻辑包含以下几个关键要素: 1. 入场信号:当EMA50向上穿越EMA150时,产生做多信号;当EMA50向下穿越EMA150时,产生做空信号。 2. 止损机制:当价格跌破SMA150时,触发止损平仓。 3. 重入场机制:在触发止损后,如果价格重新突破EMA150,则重新入场做多;如果EMA50再次下穿EMA150,则入场做空。 4. 交易执行:策略在指定的时间范围内执行交易,并考虑了0.1%的佣金和3个点的滑点。
策略优势
- 趋势跟踪能力强:通过使用不同周期的均线组合,能够有效捕捉市场趋势。
- 风险控制完善:设置了明确的止损条件,避免过大损失。
- 重入场机制灵活:允许在市场条件改善时重新入场,提高盈利机会。
- 参数设置合理:EMA50和EMA150的周期选择平衡了灵敏度和稳定性。
- 考虑实际交易成本:包含了佣金和滑点因素,更贴近实际交易环境。
策略风险
- 震荡市场风险:在横盘震荡市场可能频繁产生假突破信号。
- 滞后性风险:移动平均线指标本身具有滞后性,可能错过最佳入场时机。
- 重入场风险:在剧烈波动市场中,重入场机制可能导致连续止损。
- 资金管理风险:策略未包含具体的仓位管理方案。
- 市场环境依赖:策略在不同市场周期的表现可能存在较大差异。
策略优化方向
- 引入波动率指标:可以添加ATR或Bollinger Bands来调整止损位置,使止损更具适应性。
- 完善仓位管理:建议加入基于波动率的动态仓位管理系统。
- 优化重入场条件:可以结合RSI等摆动指标,提高重入场信号的准确性。
- 增加市场环境过滤:添加趋势强度指标,在低趋势性市场减少交易频率。
- 开发自适应参数:可以根据市场波动情况动态调整均线周期。
总结
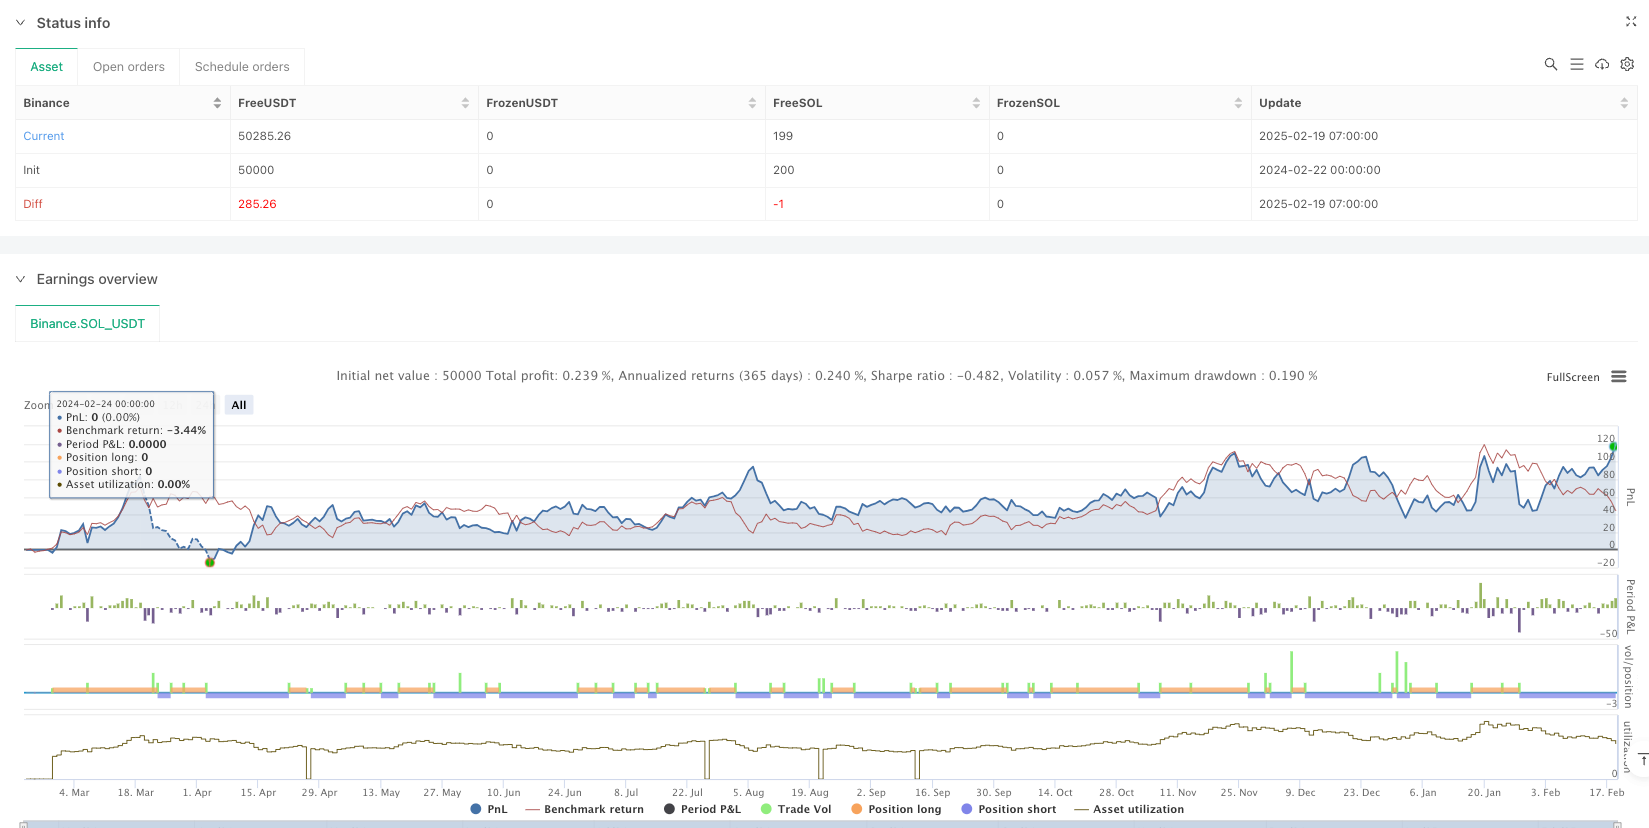
这是一个设计合理的趋势跟踪策略,通过均线交叉捕捉趋势,并配备了完善的风险控制机制。策略的主要优势在于系统的趋势跟踪能力和风险管理设计,但在实际应用中需要注意市场环境对策略表现的影响。通过建议的优化方向,策略还有进一步提升的空间。
策略源码
/*backtest
start: 2024-02-22 00:00:00
end: 2025-02-19 08:00:00
period: 1h
basePeriod: 1h
exchanges: [{"eid":"Binance","currency":"SOL_USDT"}]
*/

//@version=6
strategy("EMA 50 and EMA 150 with SMA150 Stop-loss and Re-Entry #ganges", overlay=true, commission_type=strategy.commission.percent, commission_value=0.1, slippage=3)


// EMA and SMA Calculations
ema50 = ta.ema(close, 50)
ema150 = ta.ema(close, 150)
sma150 = ta.sma(close, 150)

// Conditions for Buy, Sell, and Stop-Loss
ema50CrossAboveEMA150 = ta.crossover(ema50, ema150)  // Buy signal
ema50CrossBelowEMA150 = ta.crossunder(ema50, ema150) // Sell signal
priceCrossAboveEMA150 = ta.crossover(close, ema150) // Price crosses EMA 150 from below
priceCloseBelowSMA150 = close < sma150              // Stop-loss for long positions


// Track stop-loss hit state
var bool stopLossHit = false

// Strategy Logic
// Buy Logic: EMA 50 crosses EMA 150 from below
if ema50CrossAboveEMA150
    strategy.entry("Buy Signal", strategy.long, qty=1)
    stopLossHit := false // Reset stop-loss state when a new buy position is opened

// Sell Logic: EMA 50 crosses EMA 150 from above
if ema50CrossBelowEMA150
    strategy.entry("Sell Signal", strategy.short, qty=1)
    stopLossHit := false // Reset stop-loss state when a new sell position is opened

// Stop-Loss for Long Positions: Close if price falls below SMA 150
if strategy.position_size > 0 and priceCloseBelowSMA150
    strategy.close("Buy Signal")
    stopLossHit := true // Mark stop-loss hit

// Re-Entry Logic After Stop-Loss
if stopLossHit
    if priceCrossAboveEMA150 // Re-buy logic: PRICE crosses EMA 150 from below
        strategy.entry("Re-Buy Signal", strategy.long, qty=1)
        stopLossHit := false // Reset stop-loss state after re-entry
    if ema50CrossBelowEMA150 // Re-sell logic: EMA 50 crosses EMA 150 from above
        strategy.entry("Re-Sell Signal", strategy.short, qty=1)
        stopLossHit := false // Reset stop-loss state after re-entry

// Plot EMA and SMA Lines
plot(ema50, color=color.blue, title="EMA 50")
plot(ema150, color=color.red, title="EMA 150")
plot(sma150, color=color.orange, title="SMA 150")


// // Calculate Recent All-Time High
// highestHigh = ta.highest(high, 500) // Lookback period of 500 bars
// percentageFall = ((highestHigh - close) / highestHigh) * 100

// // Display Percentage Fall on the Most Recent Candle Only
// isLastBar = bar_index == ta.max(bar_index)
// if isLastBar
//     labelText = str.tostring(percentageFall, "#.##") + "% Fall from ATH"
//     labelPosition = high + ta.atr(14) * 2 // Positioning label above the candle
//     label.new(bar_index, labelPosition, labelText, color=color.red, textcolor=color.white, size=size.small, style=label.style_label_down)
相关推荐