
2
Follow
502
Followers
Overview
This strategy is a dual-filter trading system combining RSI (Relative Strength Index) and trend moving average. It operates on daily timeframes by integrating RSI overbought/oversold signals with long-term trend moving averages. The core innovation lies in adding a trend filter to traditional RSI trading signals to enhance accuracy and reliability.
Strategy Principles
The strategy is based on the following core components:
- RSI indicator for identifying overbought/oversold areas, default period 14
- Overbought level set at 70, oversold level at 30
- 200-period simple moving average as trend filter
- Buy condition: RSI crosses above oversold level with price above MA
- Sell condition: RSI crosses below overbought level with price below MA
The strategy automatically executes trades at each signal and can be configured with alerts.
Strategy Advantages
- Dual confirmation mechanism significantly improves trading reliability
- Combines trend and momentum indicators to reduce false signals
- Fully automated trading execution system
- Flexible parameter settings allow strategy optimization
- Integrated real-time alerts for practical operation
- Clear visualization of trading signals
- Supports backtesting for strategy validation
Strategy Risks
- May generate frequent signals in choppy markets
- Potential lag at trend reversal points
- Performance may be affected by improper parameter settings
- Large drawdowns possible during extreme market volatility
Risk management recommendations:
- Set appropriate stop-loss levels
- Adjust position sizing properly
- Regularly optimize strategy parameters
- Incorporate additional technical indicators for confirmation
Strategy Optimization Directions
- Add volatility filter to adjust trading criteria during high volatility periods
- Implement adaptive parameters based on market conditions
- Incorporate volume confirmation to improve signal reliability
- Develop more sophisticated exit mechanisms
- Integrate multiple timeframe analysis for broader market perspective
Summary
This strategy builds a robust trading system by combining RSI and trend moving averages. The design is rational, with clear operational rules and good practicality. Through proper risk management and continuous optimization, this strategy has the potential to achieve stable returns in actual trading.
Source
Pine
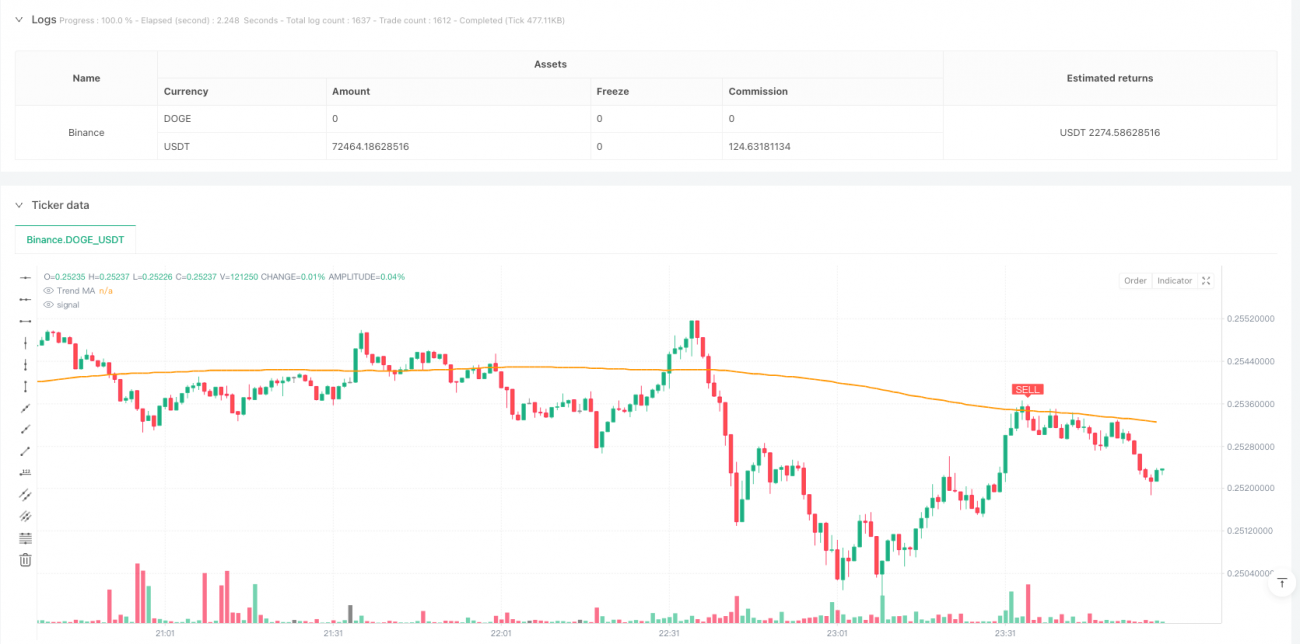
/*backtest
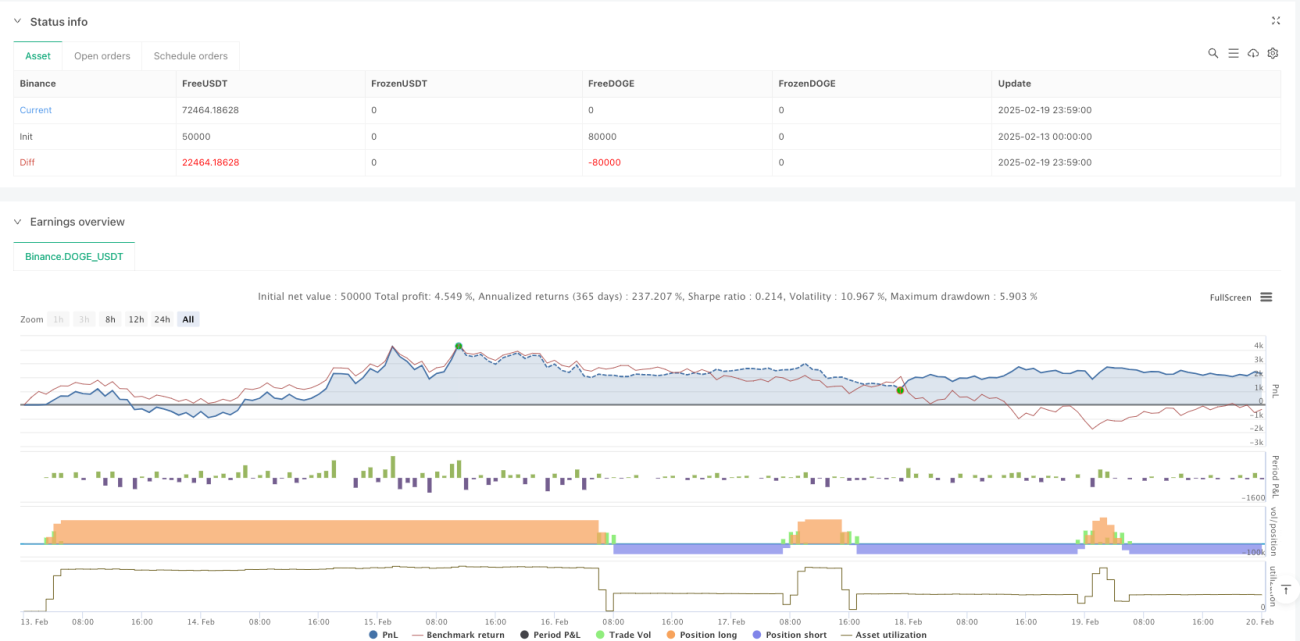
start: 2025-02-13 00:00:00
end: 2025-02-20 00:00:00
period: 1m
basePeriod: 1m
exchanges: [{"eid":"Binance","currency":"DOGE_USDT"}]
*/
//@version=5
strategy("Leading Indicator Strategy – Daily Signals", overlay=true,
pyramiding=1, initial_capital=100000,
default_qty_type=strategy.percent_of_equity, default_qty_value=100)Strategy parameters
Related strategies
Comment
All comments (0)
No data
- 1