多层移动平均线交叉精确时序趋势跟踪策略

SMA MA CROSS Trend TICK
创建日期: 2025-02-21 14:32:49 最后修改: 2025-02-21 14:32:49
复制: 1 点击次数: 51
2
关注
15
关注者

多层移动平均线交叉精确时序趋势跟踪策略 多层移动平均线交叉精确时序趋势跟踪策略

概述

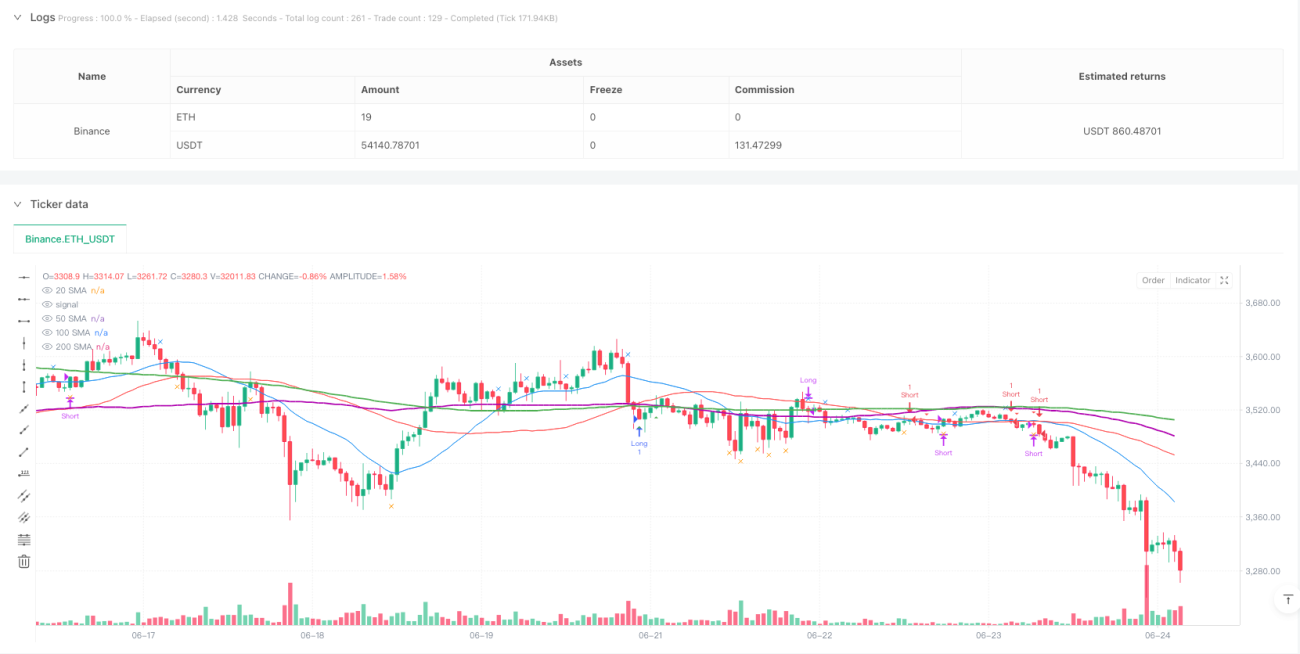
该策略是一个基于多层移动平均线(SMA)的趋势跟踪系统,结合了精确的分笔交叉检测技术。它通过20、50、100和200周期移动平均线的层级关系来确定市场趋势,并使用实时价格与移动平均线的交叉来触发交易信号。策略设计充分考虑了不同时区和交易时段的普适性,能够在各种时间周期的图表上运行。

策略原理

策略采用三层趋势过滤机制,要求50周期均线位于100周期均线之上,且100周期均线位于200周期均线之上才确认上升趋势,反之则确认下降趋势。入场信号基于价格与50周期均线的交叉,使用分笔数据实现精确的交叉检测,通过比较当前价格行为与前一根K线的位置关系来确定交叉发生的时机。出场信号则由价格与20周期均线的关系决定,当价格突破20周期均线时触发平仓信号。

策略优势

  1. 精确的交叉检测机制提高了交易时机的准确性
  2. 多层移动平均线的趋势确认方式能够有效过滤虚假信号
  3. 策略具有良好的时区适应性,可以在全球任何市场使用
  4. 入场和出场逻辑统一且清晰,便于理解和执行
  5. 可以适用于多个时间周期的图表,具有较强的普适性

策略风险

  1. 在震荡市场中可能产生频繁的假信号,导致过度交易
  2. 移动平均线本身具有滞后性,可能错过重要的转折点
  3. 在快速波动的市场中,分笔交叉检测可能产生过多信号
  4. 多层趋势过滤可能导致错过一些潜在的交易机会
  5. 固定的出场条件可能在剧烈波动时导致较大回撤

策略优化方向

  1. 引入波动率指标来动态调整进出场条件,提高策略对市场环境的适应性
  2. 增加交易量确认机制,提高交叉信号的可靠性
  3. 设计动态的止损机制,更好地控制风险
  4. 加入市场结构分析,优化趋势判断的准确性
  5. 开发自适应的参数优化机制,提高策略的稳定性

总结

这是一个结构完整、逻辑清晰的趋势跟踪策略,通过多层移动平均线的配合使用,既保证了信号的可靠性,又实现了对趋势的有效跟踪。策略的设计充分考虑了实用性和普适性,适合在不同市场环境下使用。通过进一步优化和完善,该策略有望在实际交易中取得更好的表现。

策略源码
/*backtest
start: 2024-02-22 00:00:00
end: 2024-06-25 00:00:00
period: 1h
basePeriod: 1h
exchanges: [{"eid":"Binance","currency":"ETH_USDT"}]
*/

//@version=5
strategy("Multi-SMA Strategy - Core Signals", overlay=true)

// ———— Universal Inputs ———— //
int smaPeriod1 = input(20, "Fast SMA")
int smaPeriod2 = input(50, "Medium SMA")
bool useTickCross = input(true, "Use Tick-Precise Crosses")

// ———— Timezone-Neutral Calculations ———— //
sma20 = ta.sma(close, smaPeriod1)
sma50 = ta.sma(close, smaPeriod2)
sma100 = ta.sma(close, 100)
sma200 = ta.sma(close, 200)

// ———— Tick-Precise Cross Detection ———— //
golden_cross = useTickCross ? 
  (high >= sma50 and low[1] < sma50[1]) : 
  ta.crossover(sma20, sma50)

death_cross = useTickCross ? 
  (low <= sma50 and high[1] > sma50[1]) : 
  ta.crossunder(sma20, sma50)

// ———— Trend Filter ———— //
uptrend = sma50 > sma100 and sma100 > sma200
downtrend = sma50 < sma100 and sma100 < sma200

// ———— Entry Conditions ———— //
longCondition = golden_cross and uptrend
shortCondition = death_cross and downtrend

// ———— Exit Conditions ———— //
exitLong = ta.crossunder(low, sma20)
exitShort = ta.crossover(high, sma20)

// ———— Strategy Execution ———— //
strategy.entry("Long", strategy.long, when=longCondition)
strategy.entry("Short", strategy.short, when=shortCondition)
strategy.close("Long", when=exitLong)
strategy.close("Short", when=exitShort)

// ———— Clean Visualization ———— //
plot(sma20, "20 SMA", color.new(color.blue, 0))
plot(sma50, "50 SMA", color.new(color.red, 0))
plot(sma100, "100 SMA", color.new(#B000B0, 0), linewidth=2)
plot(sma200, "200 SMA", color.new(color.green, 0), linewidth=2)

// ———— Signal Markers ———— //
plotshape(longCondition,  "Long Entry", shape.triangleup, location.belowbar, color.green, 0)
plotshape(shortCondition, "Short Entry", shape.triangledown, location.abovebar, color.red, 0)
plotshape(exitLong,  "Long Exit", shape.xcross, location.abovebar, color.blue, 0)
plotshape(exitShort, "Short Exit", shape.xcross, location.belowbar, color.orange, 0)
相关推荐
更多内容