
概述
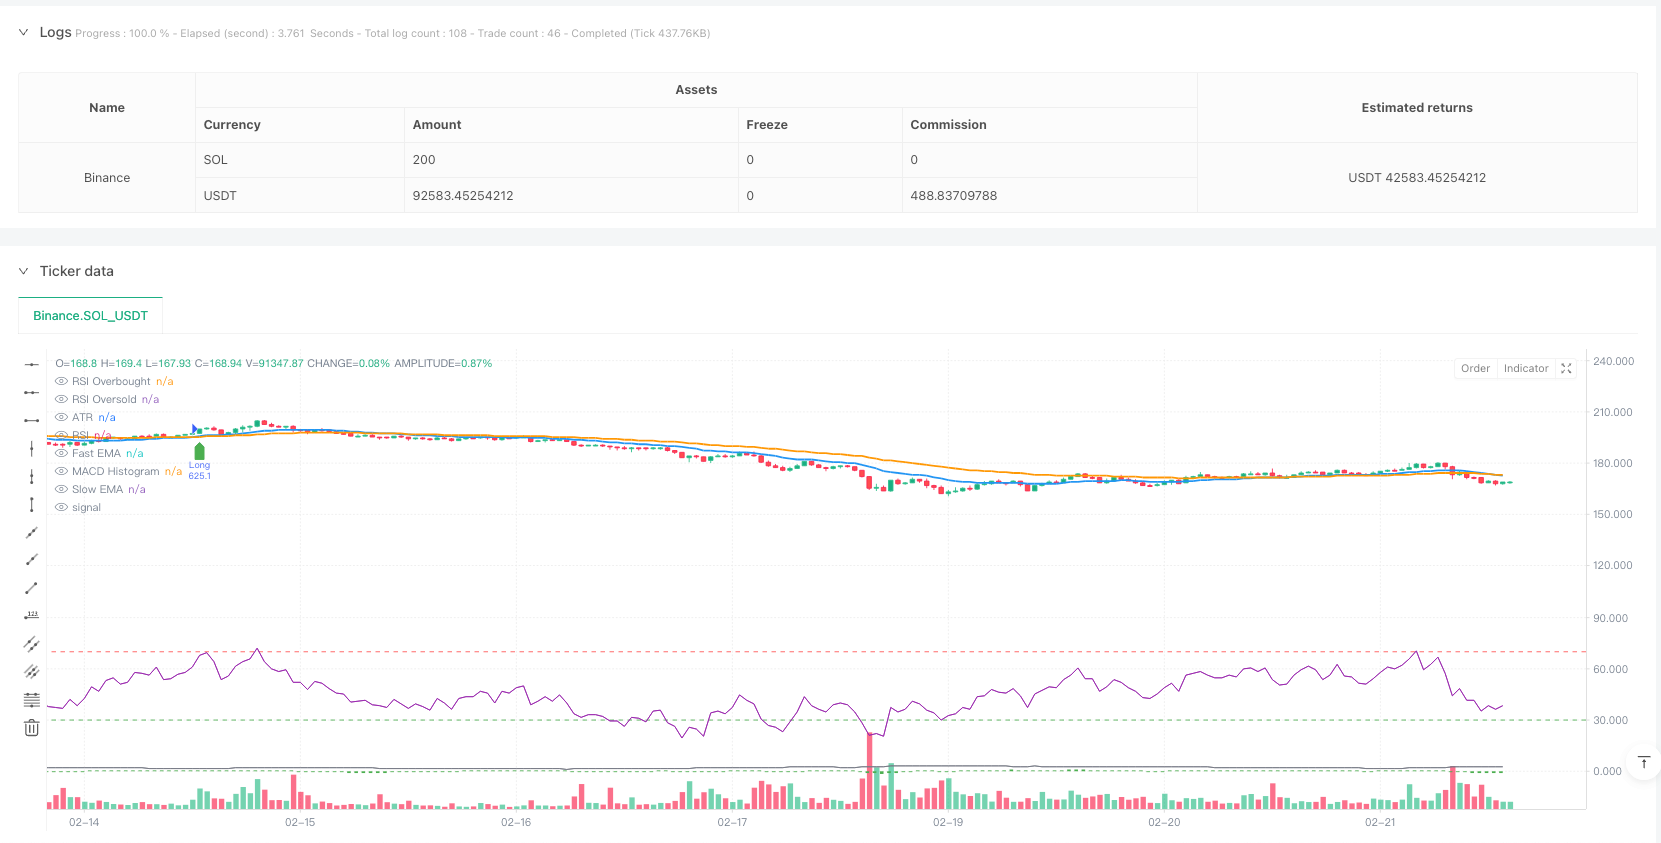
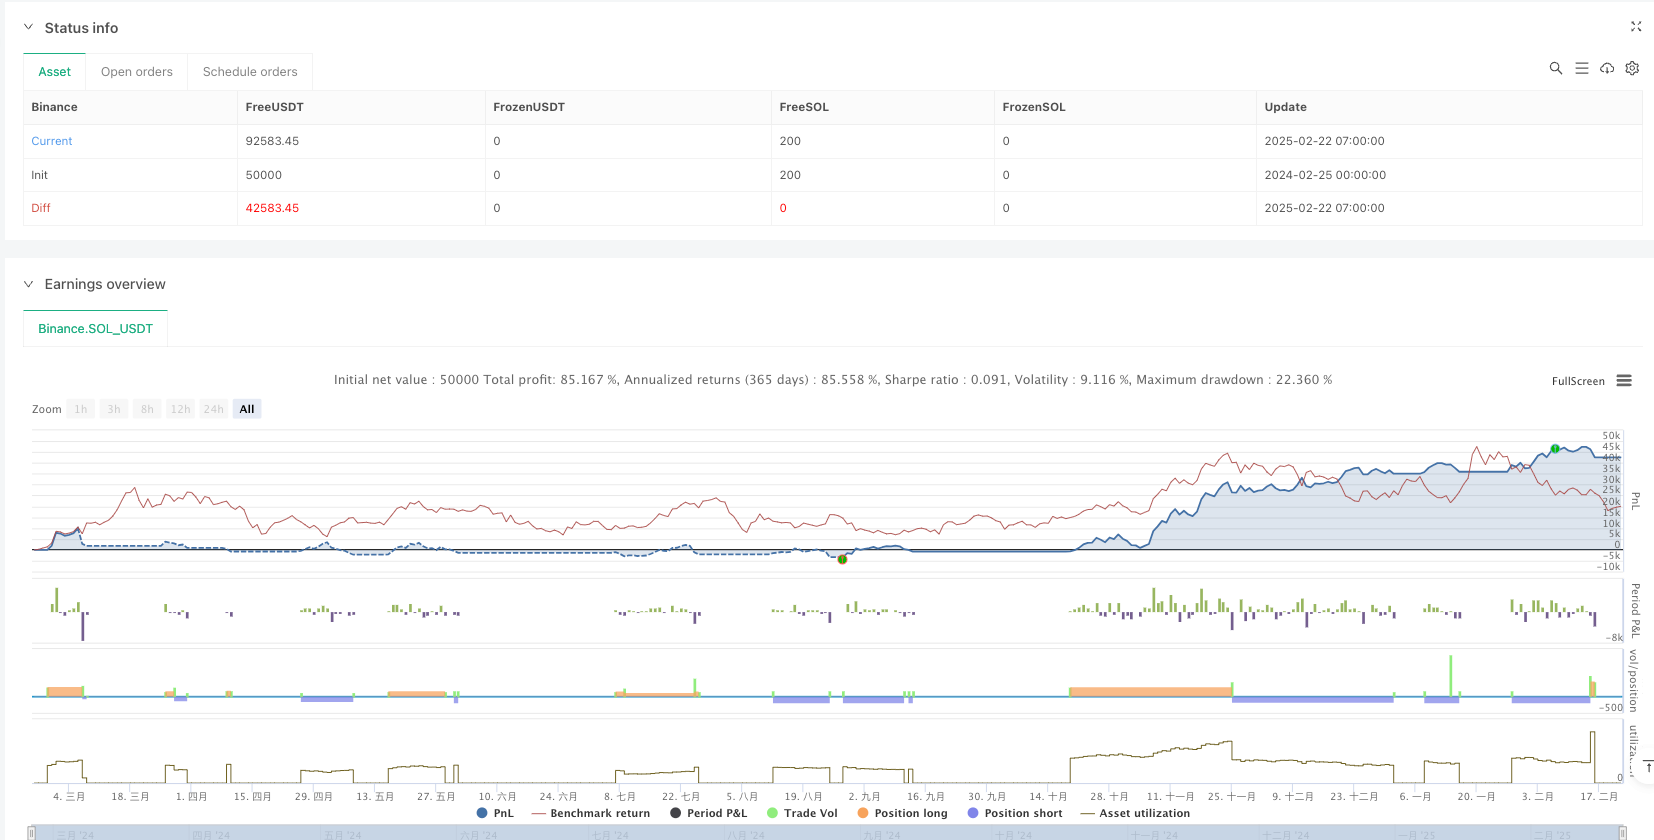
该策略是一个综合性的趋势跟踪交易系统,结合了多重技术指标来识别市场趋势和动量,同时集成了动态风险管理机制。策略通过均线交叉、相对强弱指数(RSI)和移动平均线趋同散度(MACD)的协同配合来确认交易信号,并利用真实波幅指标(ATR)来动态调整止损位置,实现风险的自适应管理。
策略原理
策略的核心逻辑建立在多重技术指标的交叉验证基础上。首先,通过快速指数移动平均线(EMA20)与慢速指数移动平均线(EMA50)的交叉来识别潜在的趋势转折点。其次,使用RSI指标来确认价格是否处于超买或超卖区域,从而避免在极端区域逆势交易。第三,引入MACD指标作为动量确认工具,通过柱状图的正负来验证趋势动能。最后,整合了基于ATR的动态止损系统,根据市场波动性自动调整止损距离。同时,策略还包含了可选的成交量过滤器,用于确认是否有足够的市场参与度。
策略优势
- 多维度信号确认机制显著降低了假突破带来的风险,提高了交易信号的可靠性。
- 动态风险管理系统能够根据市场波动情况自动调整止损位置,避免了固定止损可能带来的问题。
- 资金管理系统基于账户权益自动计算交易规模,确保了风险敞口的一致性。
- 策略具有良好的适应性,可以应用于不同的时间周期和市场环境。
- 通过成交量过滤器的设计,能够识别具有机构参与特征的强势行情。
策略风险
- 在剧烈波动的市场环境下,多重指标的滞后性可能导致入场信号延迟。
- 过多的指标过滤可能会错过一些潜在的好机会,降低策略的胜率。
- 在震荡市场中,均线交叉可能产生频繁的假信号,增加交易成本。
- ATR止损在波动率突然扩大时可能导致较大回撤。
- 依赖成交量指标可能在流动性较差的市场中产生误导性信号。
策略优化方向
- 可以引入自适应参数机制,根据不同的市场环境动态调整指标参数。
- 增加趋势强度过滤器,在弱趋势环境下降低交易频率。
- 优化止损机制,可以结合支撑位和阻力位来设置更智能的止损点。
- 加入波动率预测模型,提前调整风险管理参数。
- 开发更复杂的成交量分析模型,提高对市场参与度的判断准确性。
总结
这是一个设计完善的趋势跟踪策略,通过多重技术指标的协同作用来提高交易信号的可靠性,并配备了专业的风险管理系统。策略的可扩展性强,既可用于日内交易,也适合更长期的趋势把握。通过建议的优化方向,策略还有进一步提升的空间。在实盘应用时,建议先在回测环境中充分验证参数设置,并根据具体市场特点进行针对性调整。
策略源码
/*backtest
start: 2024-02-25 00:00:00
end: 2025-02-22 08:00:00
period: 1h
basePeriod: 1h
exchanges: [{"eid":"Binance","currency":"SOL_USDT"}]
*/

// This Pine Script™ code is subject to the terms of the Mozilla Public License 2.0 at https://mozilla.org/MPL/2.0/
// © blockchaindomain719

//@version=6
strategy("The Money Printer v2", overlay=true, default_qty_type=strategy.percent_of_equity, default_qty_value=5)

// === INPUTS ===
ema1_length = input(20, "Fast EMA")
ema2_length = input(50, "Slow EMA")

rsi_length = input(14, "RSI Length")
rsi_overbought = input(70, "RSI Overbought")
rsi_oversold = input(30, "RSI Oversold")

macd_fast = input(12, "MACD Fast")
macd_slow = input(26, "MACD Slow")
macd_signal = input(9, "MACD Signal")

atr_length = input(14, "ATR Length")
atr_mult = input(2.5, "ATR Multiplier for Stop-Loss")
trailing_mult = input(3.5, "Trailing Stop Multiplier")

use_volume = input(true, "Use Volume Filter?")
volume_mult = input(2.0, "Min Volume Multiplier")

capital_risk = input(2.0, "Risk Per Trade (%)") / 100

// === CALCULATE INDICATORS ===
ema1 = ta.ema(close, ema1_length)
ema2 = ta.ema(close, ema2_length)

rsi = ta.rsi(close, rsi_length)
macd_line = ta.ema(close, macd_fast) - ta.ema(close, macd_slow)
macd_signal_line = ta.ema(macd_line, macd_signal)
macd_hist = macd_line - macd_signal_line

atr = ta.atr(atr_length)

volume_filter = not na(volume) and volume > ta.sma(volume, 20) * volume_mult

// === ENTRY CONDITIONS ===
longEntry = ta.crossover(ema1, ema2) and rsi > rsi_oversold and macd_hist > 0 and (not use_volume or volume_filter)
shortEntry = ta.crossunder(ema1, ema2) and rsi < rsi_overbought and macd_hist < 0 and (not use_volume or volume_filter)

// === DYNAMIC RISK MANAGEMENT ===
capital = strategy.equity
risk_amount = capital * capital_risk
trade_size = risk_amount / math.max(atr * atr_mult, 1)


// Stop-Loss & Trailing Stop Calculation
longSL = close - (atr * atr_mult)
shortSL = close + (atr * atr_mult)

longTS = close - (atr * trailing_mult)
shortTS = close + (atr * trailing_mult)

// === EXECUTE TRADES ===
if longEntry
    strategy.entry("Long", strategy.long, qty=trade_size)
    strategy.exit("Trailing Stop", from_entry="Long", stop=longTS)

if shortEntry
    strategy.entry("Short", strategy.short, qty=trade_size)
    strategy.exit("Trailing Stop", from_entry="Short", stop=shortTS)

// === ALERTS ===
alertcondition(longEntry, title="BUY Signal", message="💎 Money Printer Bot: Buy Now!")
alertcondition(shortEntry, title="SELL Signal", message="🔥 Money Printer Bot: Sell Now!")

// === PLOTTING INDICATORS ===
plot(ema1, title="Fast EMA", color=color.blue, linewidth=2)
plot(ema2, title="Slow EMA", color=color.orange, linewidth=2)

// RSI Indicator
hline(rsi_overbought, "RSI Overbought", color=color.red)
hline(rsi_oversold, "RSI Oversold", color=color.green)
plot(rsi, title="RSI", color=color.purple)

// MACD Histogram
plot(macd_hist, title="MACD Histogram", color=color.green, style=plot.style_columns)

// ATR Visualization
plot(atr, title="ATR", color=color.gray)

// Buy & Sell Markers
plotshape(series=longEntry, location=location.belowbar, color=color.green, style=shape.labelup, title="BUY")
plotshape(series=shortEntry, location=location.abovebar, color=color.red, style=shape.labeldown, title="SELL")
相关推荐