
Overview
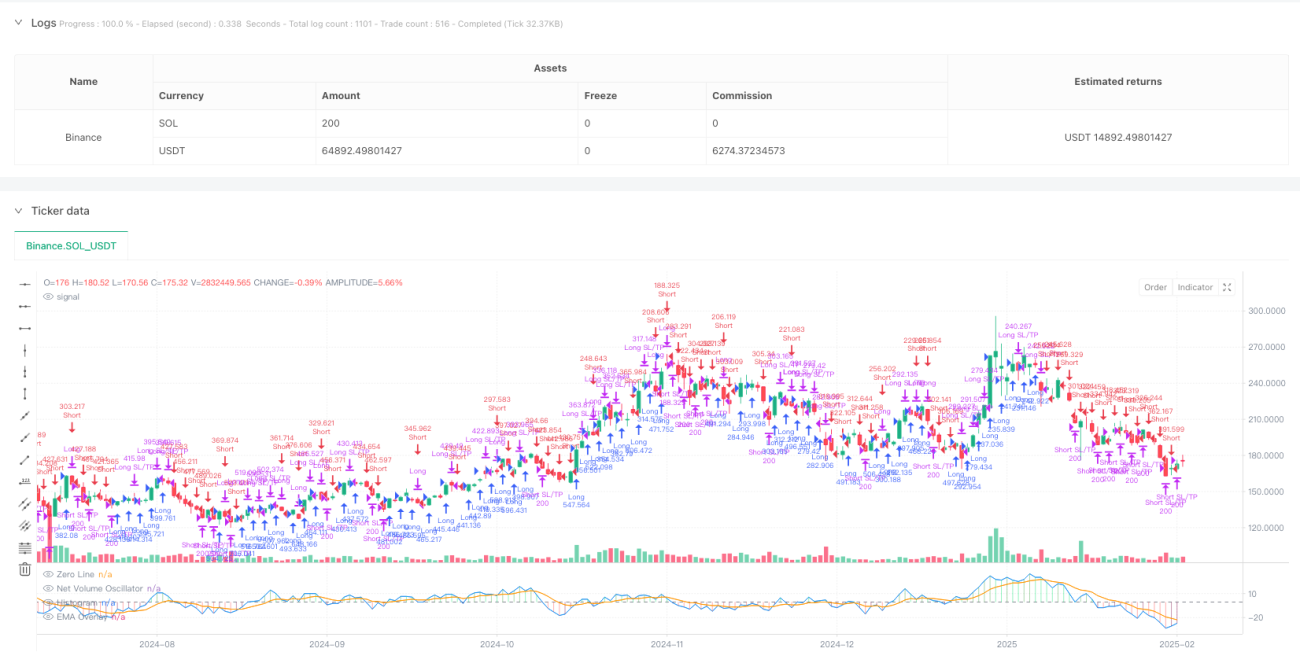
This strategy is a trend-following system based on volume and price movements, using the Net Volume Oscillator (NVO) to predict market direction. It combines multiple types of moving averages (EMA, WMA, SMA, HMA) and generates trading signals by comparing the oscillator's position relative to its EMA overlay. The strategy includes stop-loss and take-profit mechanisms for risk management.
Strategy Principles
The core mechanism calculates daily net volume oscillator values to gauge market sentiment. The calculation process includes:
- Price range multiplier calculation: Based on daily high, low, and closing prices
- Effective up/down volume calculation: Volume weighted by price movement direction and multiplier
- Net volume calculation: Effective up volume minus effective down volume
- Application of selected moving average: Smoothing the net volume data
- EMA overlay calculation: Reference line for trend determination
- Rate of Change (ROC) calculation: For trend strength analysis
Trading signals are generated based on:
- Long entry: Oscillator crosses above EMA overlay
- Short entry: Oscillator crosses below EMA overlay
- Stop-loss: Percentage-based price stops
- Take-profit: Percentage-based profit targets
Strategy Advantages
- Multi-dimensional analysis: Combines price, volume, and trend rate of change
- High flexibility: Supports multiple moving average types for different market characteristics
- Comprehensive risk management: Includes stop-loss and take-profit mechanisms
- Strong visualization: Histogram display of trend strength changes
- High adaptability: Parameterized design for different market conditions
Strategy Risks
- Trend reversal risk: May generate false signals in choppy markets
- Lag risk: Moving averages have inherent lag, potentially affecting entry/exit timing
- Parameter sensitivity: Different parameter combinations may lead to varying performance
- Market environment dependency: May underperform in certain market conditions
- Technical limitations: Relies solely on technical indicators, ignoring fundamentals
Risk control suggestions:
- Optimize parameters for different market environments
- Consider additional technical indicators for confirmation
- Adjust stop-loss and take-profit parameters based on market volatility
Strategy Optimization Directions
-
Signal confirmation optimization:
- Add volume confirmation conditions
- Implement trend strength filters
- Introduce volatility adaptation mechanisms
-
Risk management optimization:
- Develop dynamic stop-loss mechanisms
- Add position sizing module
- Implement scaled entry/exit mechanisms
-
Parameter optimization:
- Develop adaptive parameter adjustment mechanisms
- Implement market condition-based parameter switching
- Add machine learning models for parameter optimization
Summary
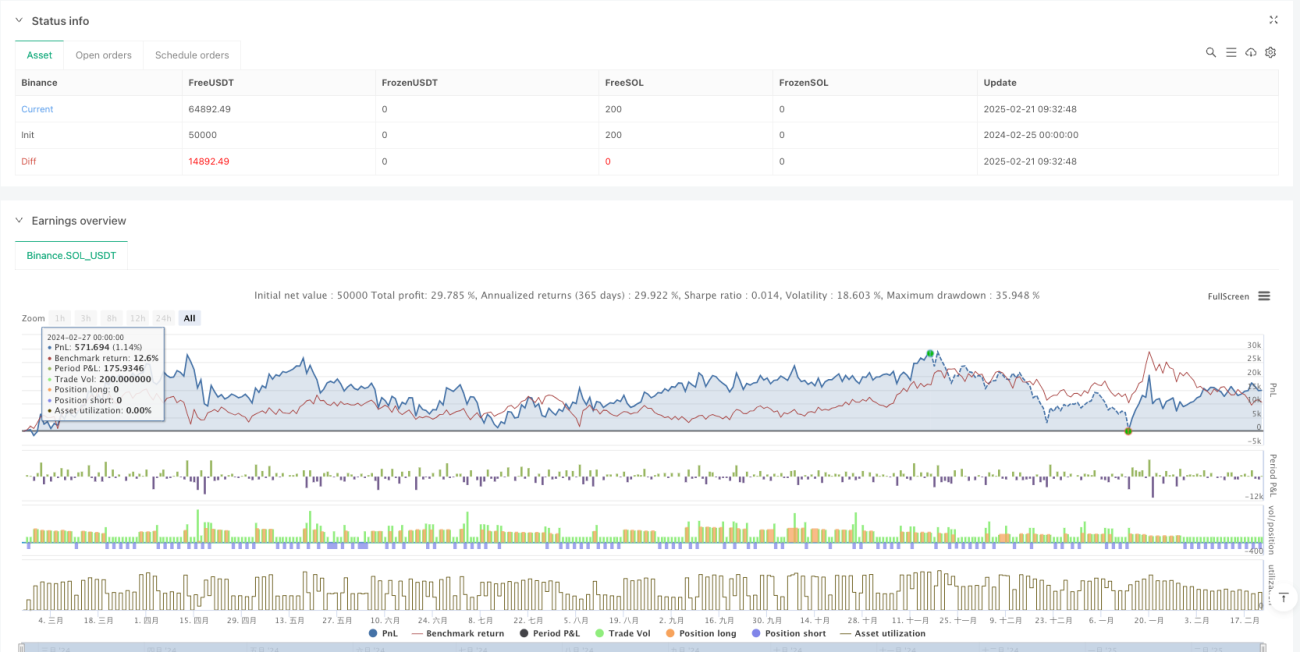
This strategy builds a comprehensive trend-following trading system through integrated analysis of volume and price data. Its main features include the combination of multiple technical indicators and flexible parameter configuration options. While certain risks exist, the strategy shows potential for stable returns through proper risk control and continuous optimization. Traders are advised to conduct thorough backtesting and adjust parameters according to specific market conditions before live trading.
/*backtest
start: 2024-02-25 00:00:00
end: 2025-02-22 08:00:00
period: 1d
basePeriod: 1d
exchanges: [{"eid":"Binance","currency":"SOL_USDT"}]
*/

//@version=5
strategy("EMA-Based Net Volume Oscillator with Trend Change", shorttitle="NVO Trend Change", overlay=false, initial_capital=100000, default_qty_type=strategy.percent_of_equity, default_qty_value=100)

// Input parameters- 1