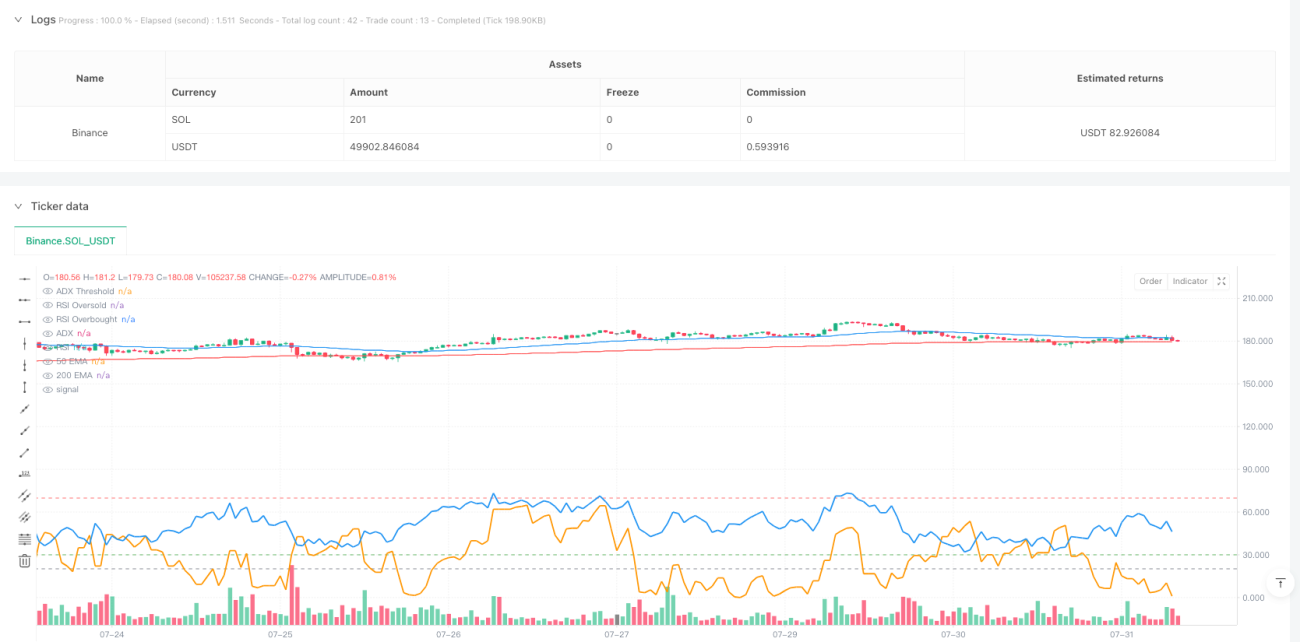
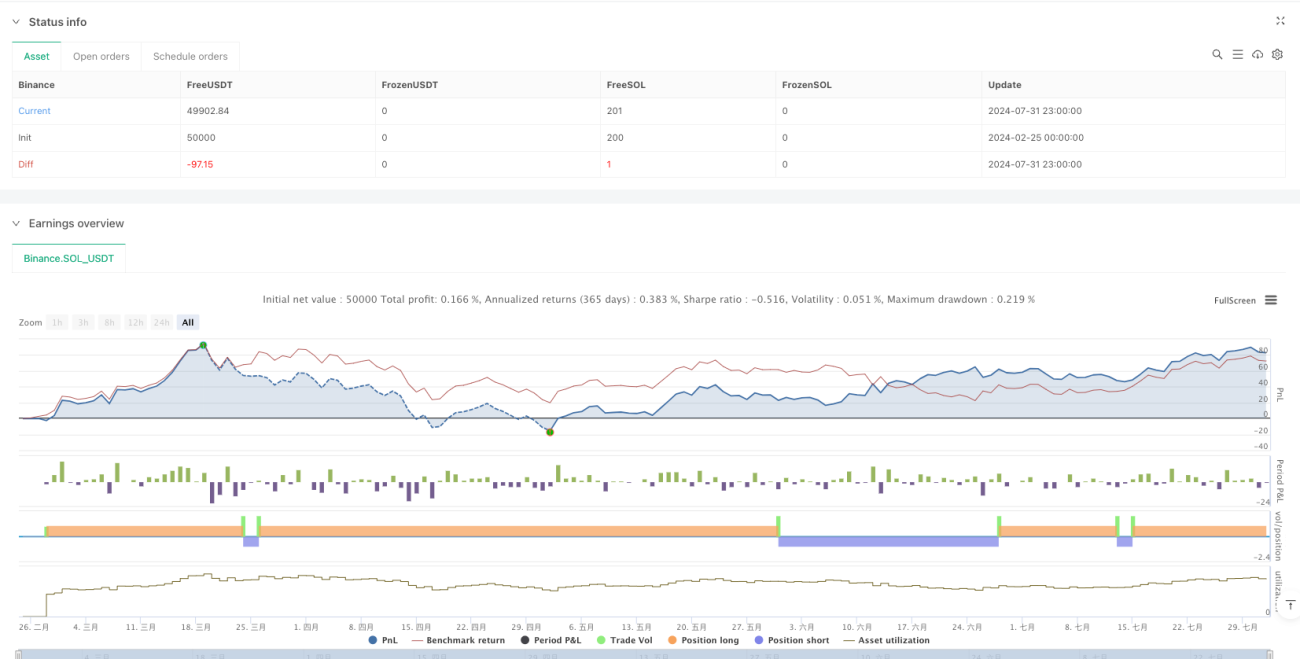
Multi-EMA Trend Momentum Crossover Trading System

概述
该策略是一个基于多重技术指标的趋势跟踪系统,结合了移动平均线(EMA)、平均趋向指标(ADX)和相对强弱指标(RSI)的优势。通过50日和200日指数移动平均线的交叉来识别市场趋势,同时利用ADX过滤弱趋势,并使用RSI避免在过度买入或过度卖出的区域进行交易。策略采用基于真实波幅(ATR)的动态止损和获利目标,既保证了风险控制,又实现了利润最大化。
策略原理
策略的核心逻辑建立在以下几个关键要素之上:
- 趋势判断:利用快速EMA(50日)与慢速EMA(200日)的交叉来确定市场趋势方向。当50日EMA上穿200日EMA时,表示进入上升趋势;当50日EMA下穿200日EMA时,表示进入下降趋势。
- 趋势强度确认:使用ADX指标来衡量趋势强度,只有当ADX值大于20时才考虑入场,确保只在强趋势中交易。
- 动量过滤:通过RSI指标进行动量过滤,只在RSI位于30-70之间时开仓,避免在过度买入或过度卖出区域交易。
- 风险管理:使用基于ATR的动态止损和获利目标,止损设置为2倍ATR,获利目标设置为4倍ATR。
策略优势
- 多维度趋势确认:通过结合均线交叉、ADX和RSI三重过滤,大大提高了交易信号的可靠性。
- 动态风险管理:基于ATR的动态止损和获利设置,能够根据市场波动性自适应调整。
- 过滤弱趋势:ADX指标的引入有效避免了在横盘市场中的频繁交易。
- 防止追高杀低:RSI过滤机制可以避免在极端区域交易。
策略风险
- 趋势反转风险:在快速反转行情中,均线系统的滞后性可能导致较大回撤。
- 震荡市风险:当市场处于区间震荡时,可能会产生频繁的假突破信号。
- 参数敏感性:多个指标的参数设置需要在不同市场环境下进行优化。
- 滑点风险:在流动性较差的市场中,实际成交价格可能与信号价格存在较大偏差。
策略优化方向
- 引入成交量指标:可以考虑添加成交量确认机制,只有在放量突破时才进行交易。
- 优化止损机制:可以考虑使用追踪止损,在趋势发展过程中保护已有利润。
- 增加时间过滤:可以添加交易时间过滤,避免在波动性较大的时段交易。
- 市场环境分类:根据不同的市场环境(趋势、震荡)动态调整策略参数。
总结
该策略通过综合运用多个技术指标,构建了一个完整的趋势跟踪交易系统。策略的优势在于多维度的信号确认机制和动态的风险管理体系,但同时也需要注意趋势反转和震荡市场带来的风险。通过持续优化和完善,该策略有望在不同市场环境下都能保持稳定的表现。
Overview
This strategy is a trend-following system based on multiple technical indicators, combining the advantages of Exponential Moving Averages (EMA), Average Directional Index (ADX), and Relative Strength Index (RSI). It identifies market trends through the crossover of 50-day and 200-day EMAs, filters weak trends using ADX, and avoids trading in overbought or oversold areas using RSI. The strategy employs dynamic stop-loss and take-profit targets based on Average True Range (ATR), ensuring both risk control and profit maximization.
Strategy Principles
The core logic of the strategy is built on the following key elements:
- Trend Identification: Uses the crossover of fast EMA (50-day) and slow EMA (200-day) to determine market trend direction. A bullish trend is signaled when the 50-day EMA crosses above the 200-day EMA, and a bearish trend when it crosses below.
- Trend Strength Confirmation: Utilizes the ADX indicator to measure trend strength, only considering entry when ADX is above 20, ensuring trades only in strong trends.
- Momentum Filtering: Applies RSI indicator for momentum filtering, only entering positions when RSI is between 30-70, avoiding trades in overbought or oversold areas.
- Risk Management: Uses ATR-based dynamic stop-loss and take-profit levels, with stop-loss set at 2x ATR and take-profit at 4x ATR.
Strategy Advantages
- Multi-dimensional Trend Confirmation: Combines EMA crossover, ADX, and RSI triple filtering to significantly improve signal reliability.
- Dynamic Risk Management: ATR-based dynamic stop-loss and take-profit settings adapt to market volatility.
- Weak Trend Filtering: Introduction of ADX effectively avoids frequent trading in ranging markets.
- Prevention of Extreme Entries: RSI filtering mechanism prevents trading in extreme areas.
Strategy Risks
- Trend Reversal Risk: The lag in moving average systems may lead to significant drawdowns in quick reversal scenarios.
- Range-bound Market Risk: May generate frequent false breakout signals during sideways markets.
- Parameter Sensitivity: Multiple indicator parameters need optimization across different market conditions.
- Slippage Risk: Actual execution prices may significantly deviate from signal prices in less liquid markets.
Strategy Optimization Directions
- Volume Indicator Integration: Consider adding volume confirmation, only trading on volume breakouts.
- Stop-loss Mechanism Enhancement: Consider implementing trailing stops to protect profits during trend development.
- Time Filter Addition: Add trading time filters to avoid high-volatility periods.
- Market Environment Classification: Dynamically adjust strategy parameters based on different market conditions (trending, ranging).
Summary
The strategy constructs a comprehensive trend-following trading system through the integrated use of multiple technical indicators. Its strengths lie in multi-dimensional signal confirmation and dynamic risk management systems, while attention must be paid to risks from trend reversals and ranging markets. Through continuous optimization and refinement, the strategy has the potential to maintain stable performance across different market environments.
- 1