Dynamic RSI and PSAR Crossover Strategy with Risk Management System

Overview
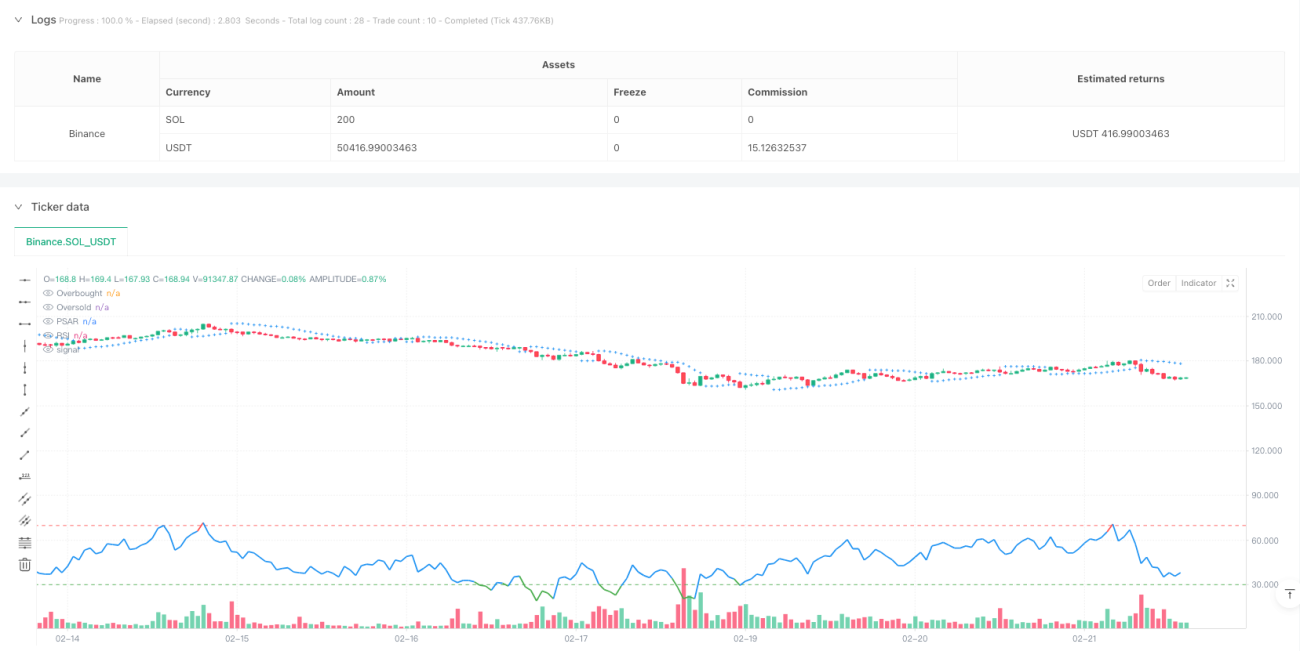
This is a trading strategy that combines the RSI indicator with the Parabolic SAR (PSAR) indicator, capturing market trends through dynamic overbought/oversold zones and PSAR crossover signals. The strategy incorporates a comprehensive risk management system, including take-profit and stop-loss mechanisms, along with position management for more robust trading performance.
Strategy Principles
The strategy is based on the following core logic:
- Entry Signal: Long position triggered when price crosses above PSAR and RSI is in oversold territory (<30)
- Exit Signal: Position closed when price crosses below PSAR and RSI is in overbought territory (>70)
- Risk Control: 5% take-profit and 3% stop-loss for each trade, adjustable based on requirements
- Signal Visualization: RSI indicator with dynamic color coding (green for oversold, red for overbought, blue for neutral) for intuitive market state display
- Trade Alerts: Automatic notifications when buy/sell signals are triggered
Strategy Advantages
- Signal Reliability: Reduces false signals through dual confirmation with PSAR and RSI
- Risk Control: Built-in take-profit and stop-loss mechanisms limit single trade losses
- Clear Operation: Visual interface design provides intuitive trading signals
- High Adaptability: Adjustable parameters suit different market conditions
- High Automation: Supports automated trading and backtesting analysis
Strategy Risks
- Unsuitable for Ranging Markets: May generate frequent trades in sideways markets
- Slippage Impact: Potential significant slippage risk in high volatility environments
- Parameter Sensitivity: Different parameter combinations may lead to varying strategy performance
- Stop Loss Risk: Fixed stop-loss levels may lack flexibility in certain market conditions
- Signal Lag: Indicators have inherent lag, possibly missing optimal entry points
Strategy Optimization Directions
- Market Environment Assessment: Add trend strength indicators for parameter adaptation
- Dynamic Stop-Loss: Automatically adjust stop-loss levels based on market volatility
- Position Management Optimization: Implement dynamic position sizing based on risk assessment
- Time Filtering: Add trading time windows to avoid unfavorable periods
- Signal Confirmation: Include volume and other auxiliary indicators to improve signal reliability
Summary
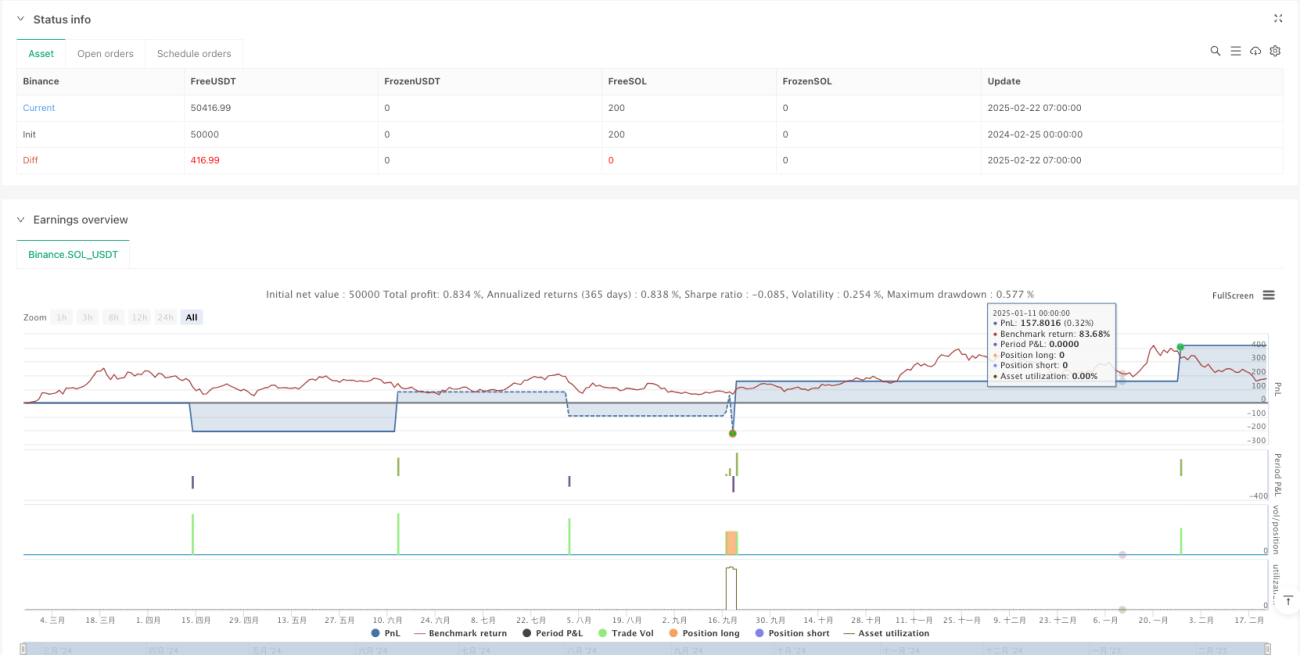
The strategy establishes a complete trading system by combining PSAR and RSI indicators. Its strengths lie in clear signals and controlled risk, though market environment adaptability requires attention. Through continuous optimization and parameter adjustment, the strategy can achieve better trading results. It's recommended to conduct thorough backtesting before live trading and adjust parameters according to specific market characteristics.
/*backtest
start: 2024-02-25 00:00:00
end: 2025-02-22 08:00:00
period: 1h
basePeriod: 1h
exchanges: [{"eid":"Binance","currency":"SOL_USDT"}]
*/

//@version=5
strategy("PSAR & RSI Strategy with Risk Management", overlay=true, default_qty_type=strategy.percent_of_equity, default_qty_value=10)

// User Inputs- 1