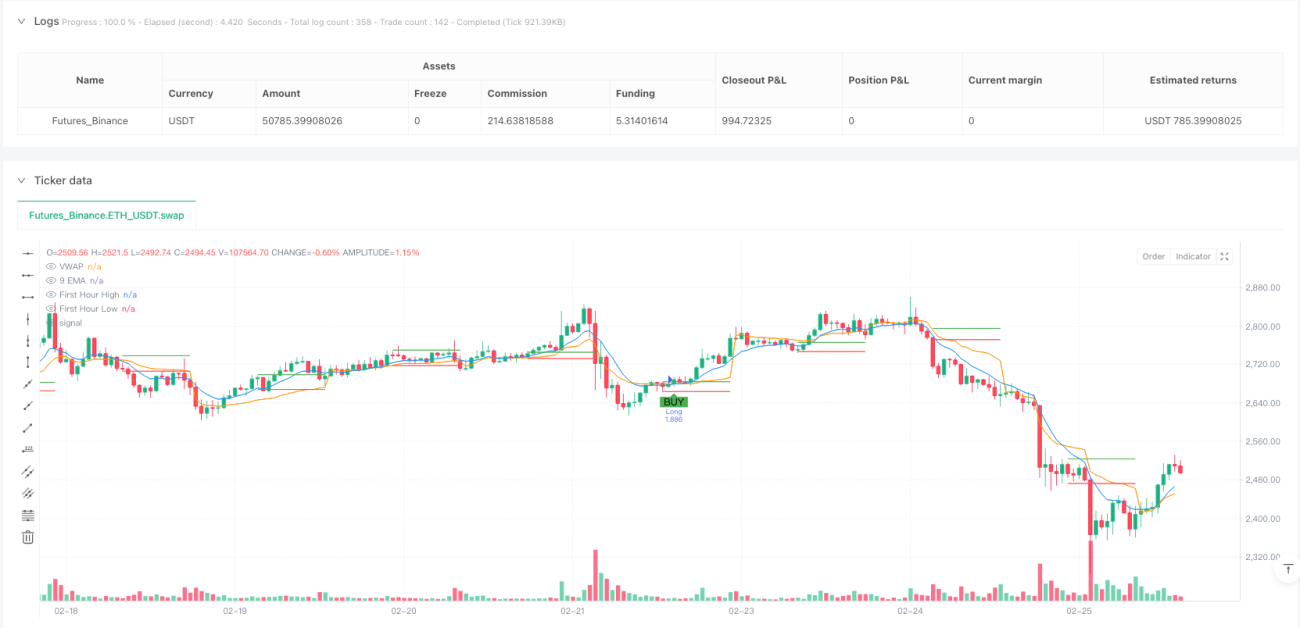
该策略是一种专为日内交易设计的量化交易系统,核心思想围绕市场首个小时的价格行为展开。策略通过识别市场开盘首小时的高低点作为关键突破水平,结合EMA(指数移动平均线)、VWAP(成交量加权平均价格)和动态ATR(平均真实范围)止损机制,构建了一个完整的交易体系。该策略特别注重入场时机的选择,只在市场首小时结束后才允许交易信号触发,这有助于避开早盘的波动和假突破。此外,策略还利用EMA的斜率作为趋势确认工具,确保交易方向与短期趋势一致,从而提高交易的成功率。
策略核心逻辑可分为几个关键部分:
首小时高低点确定:策略监控并记录市场开盘后首个小时(从9:15开始的60分钟)的最高价和最低价,这两个价格水平将作为潜在突破点。
技术指标计算:
入场条件:
出场策略:
资金管理:
这种设计理念结合了突破交易、趋势确认和动态风险管理,形成了一个完整且系统化的交易方法。通过要求价格突破与技术指标确认同时发生,策略有效降低了假突破的风险。
深入分析该策略代码,可以总结出以下几个明显优势:
精准的入场时机:通过首小时高低点作为关键水平,策略能够捕捉日内重要的突破机会。市场首小时往往设定了当日的交易区间,突破这些水平通常意味着有强劲的动能推动。
多重确认机制:策略不仅依赖价格突破,还要求EMA与VWAP的交叉确认以及EMA斜率的方向一致性,这种多重过滤大大减少了假信号。
动态风险管理:使用ATR作为止损基础,策略能根据市场波动性自动调整止损距离,在波动较大时给予价格更多呼吸空间,在波动较小时收紧止损以保护利润。
明确的交易规则:策略定义了清晰的入场和出场条件,减少了主观判断,有助于维持交易纪律。
视觉辅助功能:代码包含了信号标记和关键水平的可视化,帮助交易者直观理解策略逻辑和实时监控交易机会。
适应市场节奏:通过仅在首小时结束后才允许入场,策略避开了开盘时常见的无序波动,专注于更有可能持续的移动。
尽管该策略设计合理,但仍存在一些潜在风险和局限性:
过度依赖单一时间段:策略过度依赖首小时形成的高低点,如果这一时段不具代表性(例如异常低波动或受到临时新闻影响),可能导致后续交易信号质量下降。
固定止盈比例的局限性:1%的固定止盈目标可能无法适应不同市场环境和不同波动性资产。在强趋势日,这可能导致过早获利了结,错失更大潜在盈利。
EMA和VWAP延迟风险:作为滞后指标,EMA和VWAP的交叉信号可能出现在价格已经显著突破后,导致入场价格不理想。
没有考虑市场整体环境:策略没有纳入更广泛的市场环境评估(如整体市场趋势、波动性环境或相关性分析),可能在某些市场条件下表现欠佳。
日内策略的执行挑战:作为日内策略,要求较高的执行效率和较低的滑点,这在实际交易中可能面临挑战。
为降低这些风险,建议: - 结合其他技术或基本面过滤条件 - 根据资产特性调整ATR倍数和止盈目标 - 考虑增加时间过滤,避免在低效率时段交易 - 定期回测并根据市场变化调整参数
基于对策略逻辑和潜在风险的分析,以下是几个值得考虑的优化方向:
自适应参数调整:
增加市场环境过滤:
优化首小时逻辑:
改进出场机制:
增强风险管理:
这些优化方向旨在保留策略核心逻辑的同时,提高其适应性和稳健性,使其能在更广泛的市场条件下保持有效。
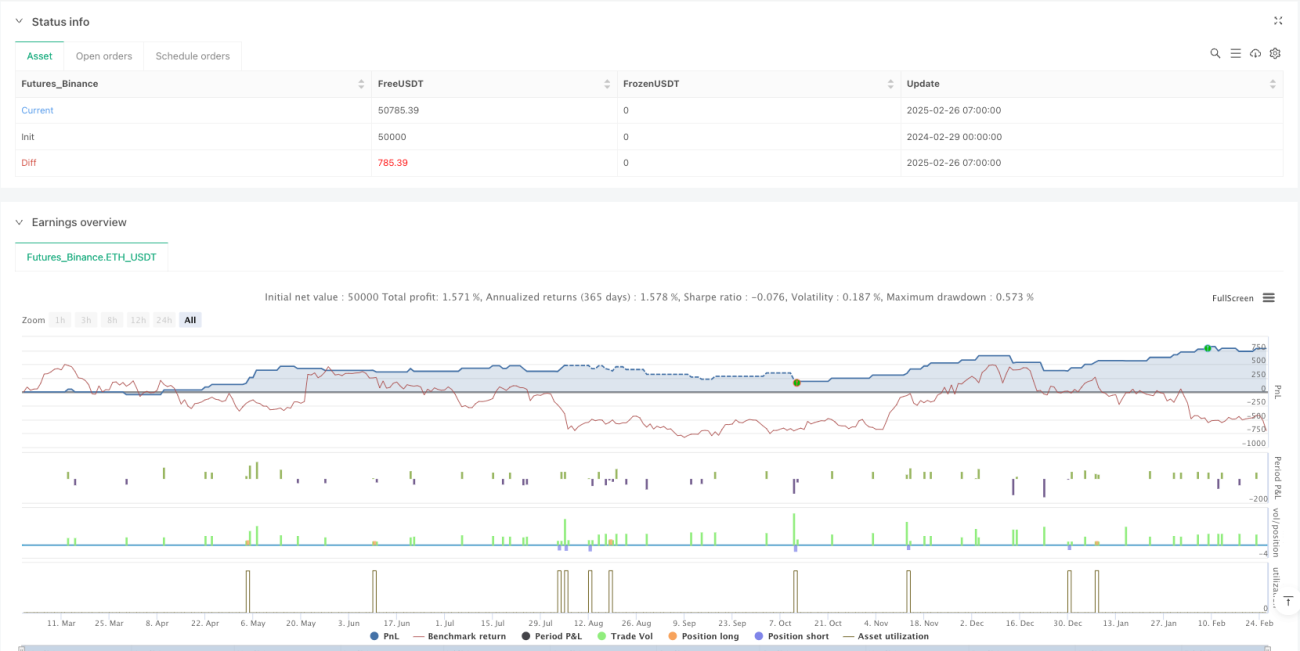
首时段ATR止损与EMA斜率优化策略是一种结构完善的日内量化交易系统,通过结合首小时高低点突破、技术指标确认和动态风险管理,为交易者提供了一种系统化的交易方法。该策略最大的优势在于其多重确认机制和清晰的交易规则,这有助于减少假信号并维持交易纪律。
然而,策略也存在一些局限性,如过度依赖单一时间段和固定止盈目标的适应性问题。通过实施建议的优化措施,如自适应参数调整、增加市场环境过滤和改进出场机制,交易者可以进一步提高策略的稳健性和适应性。
总体而言,这是一个基础扎实、思路清晰的交易策略,特别适合对日内交易感兴趣的量化交易者。通过适当的参数调整和优化,它有潜力成为交易组合中的有效工具。值得注意的是,任何交易策略都需要经过充分的回测和验证,并结合个人风险承受能力进行适当的资金管理。
/*backtest
start: 2024-02-29 00:00:00
end: 2025-02-26 08:00:00
period: 1h
basePeriod: 1h
exchanges: [{"eid":"Futures_Binance","currency":"ETH_USDT"}]
*/
//@version=5
strategy("FnO Intraday Strategy with ATR SL, EMA Slope & Signals", overlay=true, initial_capital=100000, default_qty_type=strategy.percent_of_equity, default_qty_value=10)
// INPUTS
atrPeriod = input.int(14, "ATR Period")
atrMultiplier = input.float(1.0, "ATR Stop Loss Multiplier", step=0.1)
targetPercent = input.float(1.0, "Profit Target (%)", step=0.1) * 0.01
// Define session start and first candle period (for Indian market, session starts at 09:15)
sessionStartHour = input.int(9, "Session Start Hour", minval=0, maxval=23)
sessionStartMinute = input.int(15, "Session Start Minute", minval=0, maxval=59)
firstCandleMins = 60 // First candle duration in minutes
// Compute today's session start and first candle end timestamps
currYear = year(time)
currMonth = month(time)
currDay = dayofmonth(time)
sessionStartTS = timestamp(currYear, currMonth, currDay, sessionStartHour, sessionStartMinute)
sessionEndTS = sessionStartTS + firstCandleMins * 60 * 1000 // PineScript time is in ms
// INITIALIZE first-hour high/low (reset at the start of each day)
var float firstHourHigh = na
var float firstHourLow = na
if (ta.change(time("D")))
firstHourHigh := na, firstHourLow := na
// Update first-hour high/low while within the first candle period
if (time >= sessionStartTS and time <= sessionEndTS)
firstHourHigh := na(firstHourHigh) ? high : math.max(firstHourHigh, high)
firstHourLow := na(firstHourLow) ? low : math.min(firstHourLow, low)
// Plot the first-hour high and low once the first candle period is over
plot(time > sessionEndTS ? firstHourHigh : na, title="First Hour High", color=color.green, style=plot.style_linebr)
plot(time > sessionEndTS ? firstHourLow : na, title="First Hour Low", color=color.red, style=plot.style_linebr)
// Calculate indicators: 9 EMA, VWAP, and EMA slope
ema9 = ta.ema(close, 9)
vwapVal = ta.vwap(hlc3) // Using typical price for VWAP calculation
emaSlope = ema9 - ema9[1]
// Define "first hour complete" flag so entries only occur after the first candle period
firstHourComplete = time > sessionEndTS
// ENTRY CONDITIONS
// Long: Price breaks above first-hour high, and 9 EMA crosses above VWAP with a positive slope.
longBreakout = ta.crossover(close, firstHourHigh)
longEMAConfirmation = ta.crossover(ema9, vwapVal) and (emaSlope > 0)
longCondition = firstHourComplete and longBreakout and longEMAConfirmation
// Short: Price breaks below first-hour low, and 9 EMA crosses below VWAP with a negative slope.
shortBreakout = ta.crossunder(close, firstHourLow)
shortEMAConfirmation = ta.crossunder(ema9, vwapVal) and (emaSlope < 0)
shortCondition = firstHourComplete and shortBreakout and shortEMAConfirmation
// Generate entries
if (longCondition)
strategy.entry("Long", strategy.long)
if (shortCondition)
strategy.entry("Short", strategy.short)
// Add buy and sell signals on the chart
plotshape(longCondition, title="Buy Signal", location=location.belowbar, color=color.green, style=shape.labelup, text="BUY")
plotshape(shortCondition, title="Sell Signal", location=location.abovebar, color=color.red, style=shape.labeldown, text="SELL")
// Calculate ATR for dynamic stop loss
atrValue = ta.atr(atrPeriod)
// Set exits using ATR-based stop loss and fixed profit target (1% gain)
if (strategy.position_size > 0)
longStop = strategy.position_avg_price - atrValue * atrMultiplier
longTarget = strategy.position_avg_price * (1 + targetPercent)
strategy.exit("Long Exit", from_entry="Long", stop=longStop, limit=longTarget)
if (strategy.position_size < 0)
shortStop = strategy.position_avg_price + atrValue * atrMultiplier
shortTarget = strategy.position_avg_price * (1 - targetPercent)
strategy.exit("Short Exit", from_entry="Short", stop=shortStop, limit=shortTarget)
// Plot EMA and VWAP for visual confirmation
plot(ema9, title="9 EMA", color=color.blue)
plot(vwapVal, title="VWAP", color=color.orange)