
Overview
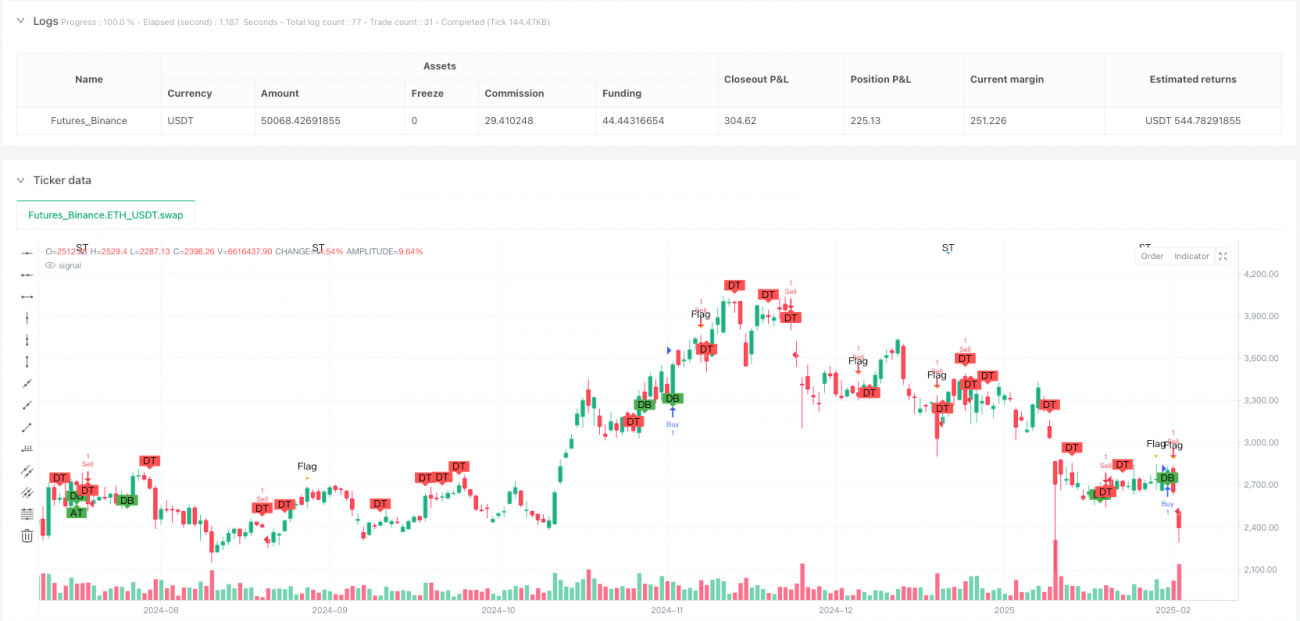
The Technical Chart Pattern Confirmation Momentum Strategy is a trading system based on the recognition of multiple classic chart patterns combined with momentum confirmation. This strategy primarily identifies common market technical formations such as Head and Shoulders, Inverse Head and Shoulders, Double Tops, Double Bottoms, Triangles (Symmetrical, Ascending, Descending), Flags, Wedges, and others, generating signals when breakouts from these patterns occur. The strategy cleverly incorporates the ATR indicator to set dynamic stop-loss and take-profit levels, effectively controlling risk and securing profits. This approach not only captures various market turning points but also enhances signal reliability through pattern breakout confirmation mechanisms, reducing risks associated with false breakouts.
Strategy Principles
The core principle of the strategy is to identify different chart patterns through a series of condition functions and confirm trading signals when prices break through key levels:
-
Head and Shoulders/Inverse Head and Shoulders Detection: Identifies the characteristic structure of head and shoulders formations by comparing the relative positions of consecutive high/low points. A head and shoulders pattern forms when high point 1 is greater than high points 0, 2, 3, and 4, and high point 0 is less than high points 2 and 3.
-
Double Top/Double Bottom Detection: Analyzes sequences of highs/lows to identify double top and double bottom patterns. In a double top, high point 1 needs to be greater than surrounding highs; in a double bottom, low point 1 needs to be less than surrounding lows.
-
Triangle Pattern Detection:
- Symmetrical Triangle: Highs descend while lows ascend, forming a convergence pattern
- Ascending Triangle: Highs remain relatively stable while lows ascend, forming a bullish pattern
- Descending Triangle: Highs descend while lows remain relatively stable, forming a bearish pattern
-
Flag/Pennant Detection: Identifies these patterns by analyzing consecutive changes in high and low points.
-
Trade Signal Confirmation:
- Long Signal: Triggered when an Inverse Head and Shoulders, Double Bottom, or Ascending Triangle is identified, and the closing price breaks above the previous bar's high
- Short Signal: Triggered when a Double Top, Descending Triangle, or Flag pattern is identified, and the closing price breaks below the previous bar's low
-
Risk Management:
- Uses 14-period ATR to calculate dynamic stop-loss and take-profit levels
- Stop-loss is set at 1.5 times ATR
- Take-profit is set at 3 times ATR, providing a risk-reward ratio of 1:2
Strategy Advantages
-
Systematic Pattern Recognition: The strategy implements automatic identification of multiple classic chart patterns through clearly defined condition functions, reducing biases associated with subjective judgment.
-
Signal Confirmation Mechanism: The strategy not only identifies chart patterns but also requires price breakouts of key levels as confirmation, reducing risks from false breakouts.
-
Dynamic Risk Management: Uses the ATR indicator to set dynamic stop-loss and take-profit levels, adapting risk control to market volatility changes.
-
Multi-Pattern Coverage: The strategy includes various classic chart patterns, increasing trading opportunities and adapting to different market environments.
-
Visual Display: The strategy uses plotshape functions to visually display identified patterns on the chart, helping traders understand and verify strategy logic.
-
Reasonable Risk-Reward Ratio: The strategy sets take-profit at 3 times ATR and stop-loss at 1.5 times ATR, providing a risk-reward ratio of 1:2, consistent with effective risk management principles.
Strategy Risks
-
Limited Pattern Recognition Accuracy: The current pattern recognition algorithms are relatively simplified and may produce false identifications or miss valid patterns, especially in noisy market conditions.
-
Parameter Sensitivity: ATR period settings and the multiples used for stop-loss and take-profit significantly impact strategy performance and need optimization for different markets and timeframes.
-
False Breakout Risk: Despite confirmation mechanisms, false breakouts still occur in markets and may lead to unnecessary trading losses.
-
Pattern Redundancy: Some pattern recognition functions in the current code have similar logic (such as Head and Shoulders and Double Top), potentially triggering multiple signals in the same market situation, increasing trading frequency and costs.
-
Lack of Trend Filtering: The strategy doesn't consider overall market trend direction and may generate counter-trend signals in strong trends, leading to adverse trading.
Risk mitigation methods:
- Add additional filtering conditions, such as volume confirmation and trend indicator filtering
- Optimize pattern recognition algorithms with more validation conditions
- Implement more conservative position management
- Consider adding time filters to avoid trading before and after important news or events
- Conduct more extensive backtesting to find optimal parameter combinations
Strategy Optimization Directions
-
Improve Pattern Recognition Algorithms:
- Add more validation conditions, such as pattern size, formation time, price change magnitude
- Differentiate recognition criteria between similar patterns like Head and Shoulders and Double Tops
- Add more complex patterns like Cup and Handle, Rising/Falling Wedges
-
Add Volume Confirmation:
- Add volume expansion confirmation conditions during pattern breakouts
- Analyze volume change patterns during formation development
-
Trend Filtering:
- Add trend indicators (such as moving averages, ADX) to only trade when trend direction aligns with pattern signals
- Consider longer timeframe market structure
-
Optimize Risk Management:
- Test different ATR multiple settings
- Implement volatility-based dynamic position sizing
- Consider partial profit-taking strategies to secure profits
-
Add Time Filtering:
- Avoid trading during low volatility periods or before/after important news releases
- Consider market seasonality factors
-
Multi-Timeframe Analysis:
- Confirm trend direction on higher timeframes
- Optimize entry points on lower timeframes
These optimization directions would significantly improve the strategy's robustness and efficiency because:
- More precise pattern recognition reduces erroneous signals
- Volume confirmation increases signal reliability
- Trend filtering avoids counter-trend trading
- Optimized risk management improves capital efficiency and protection
- Multi-timeframe analysis provides a more comprehensive market perspective
Summary
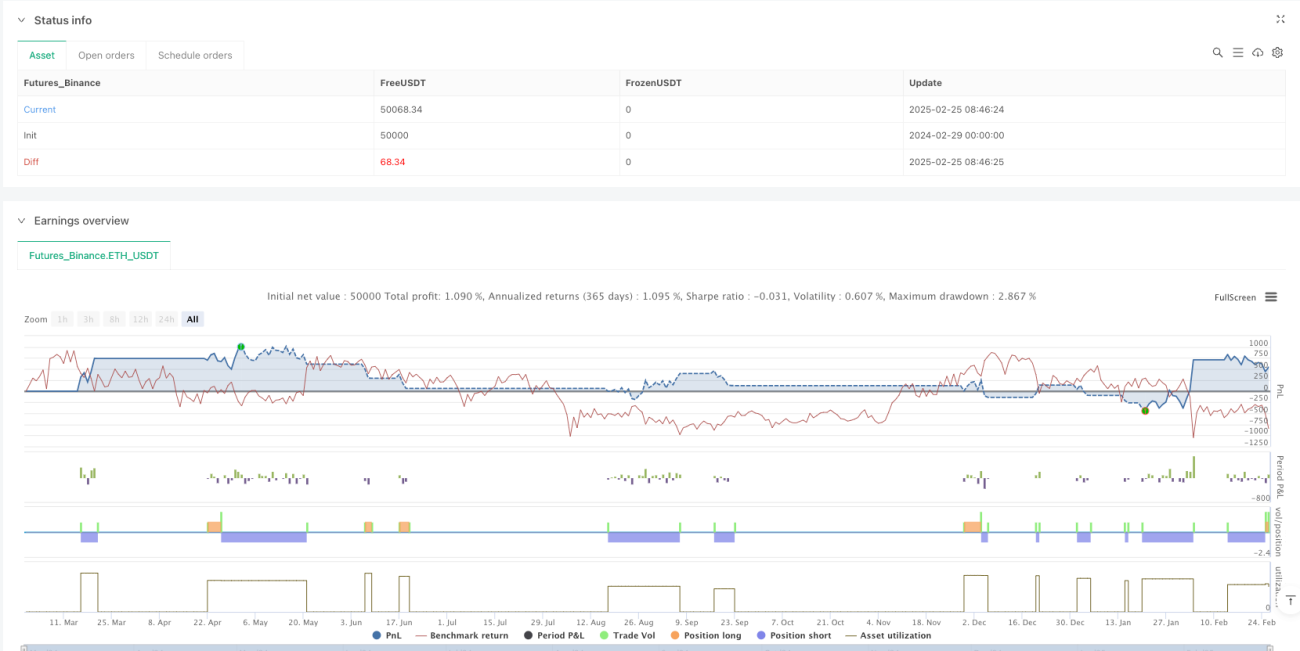
The Technical Chart Pattern Confirmation Momentum Strategy is a systematic trading system with clear rules, generating trading signals by identifying multiple classic chart patterns combined with breakout confirmation. The strategy employs the ATR indicator for dynamic risk management with a reasonable risk-reward ratio. While the current version's pattern recognition algorithms are relatively simplified, they provide a good foundation for further optimization. By adding volume confirmation, trend filtering, risk management optimization, and multi-timeframe analysis, this strategy has the potential to become a powerful and robust trading system. This chart pattern-based approach is particularly suitable for volatile markets and instruments with distinctive price action, helping traders systematically capture market turning points and breakout opportunities.
- 1