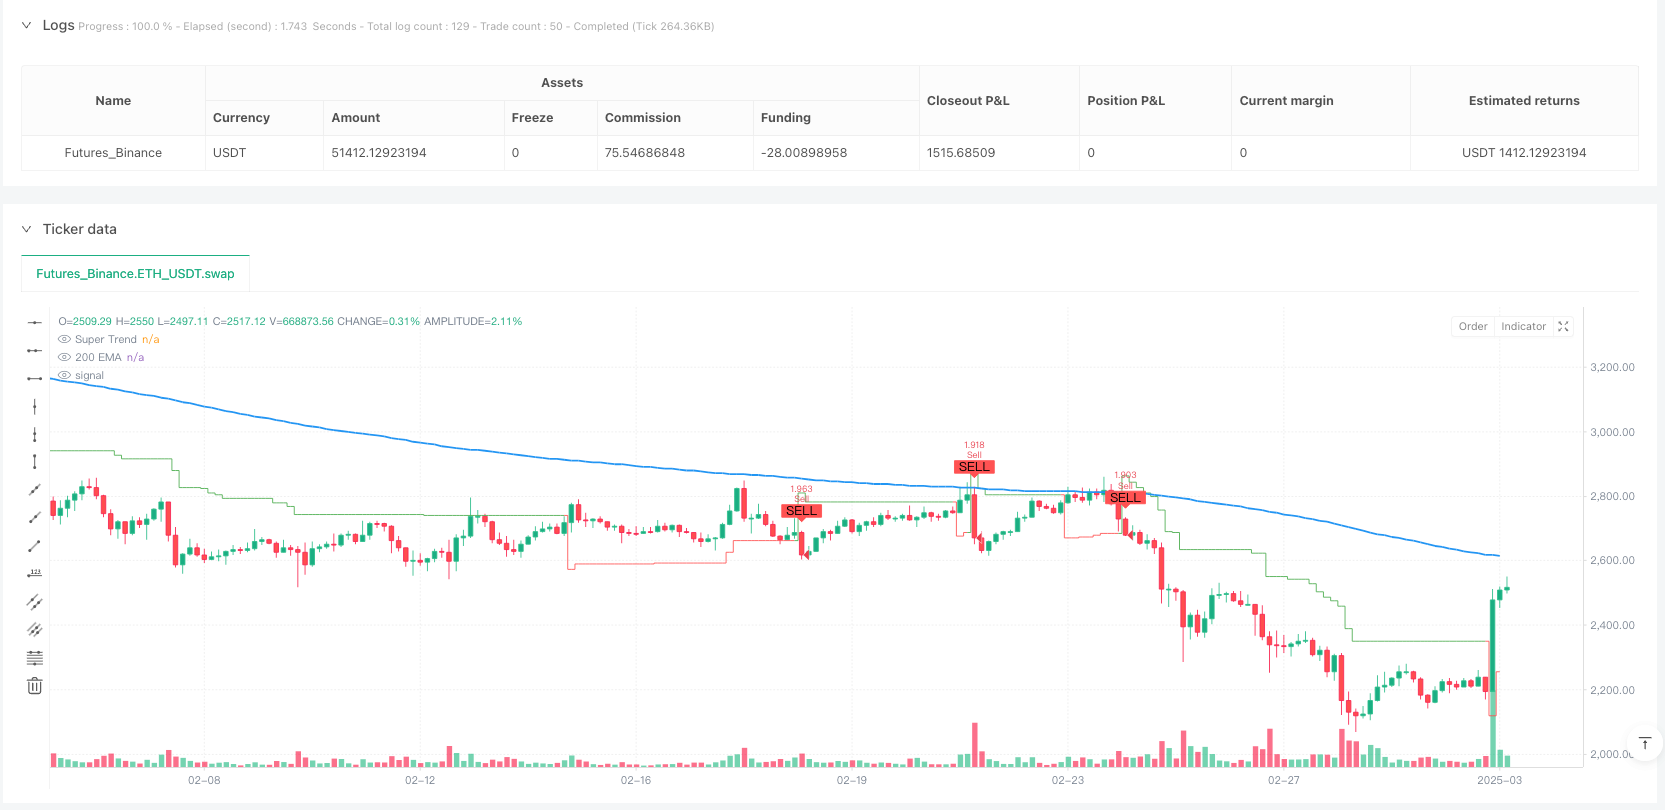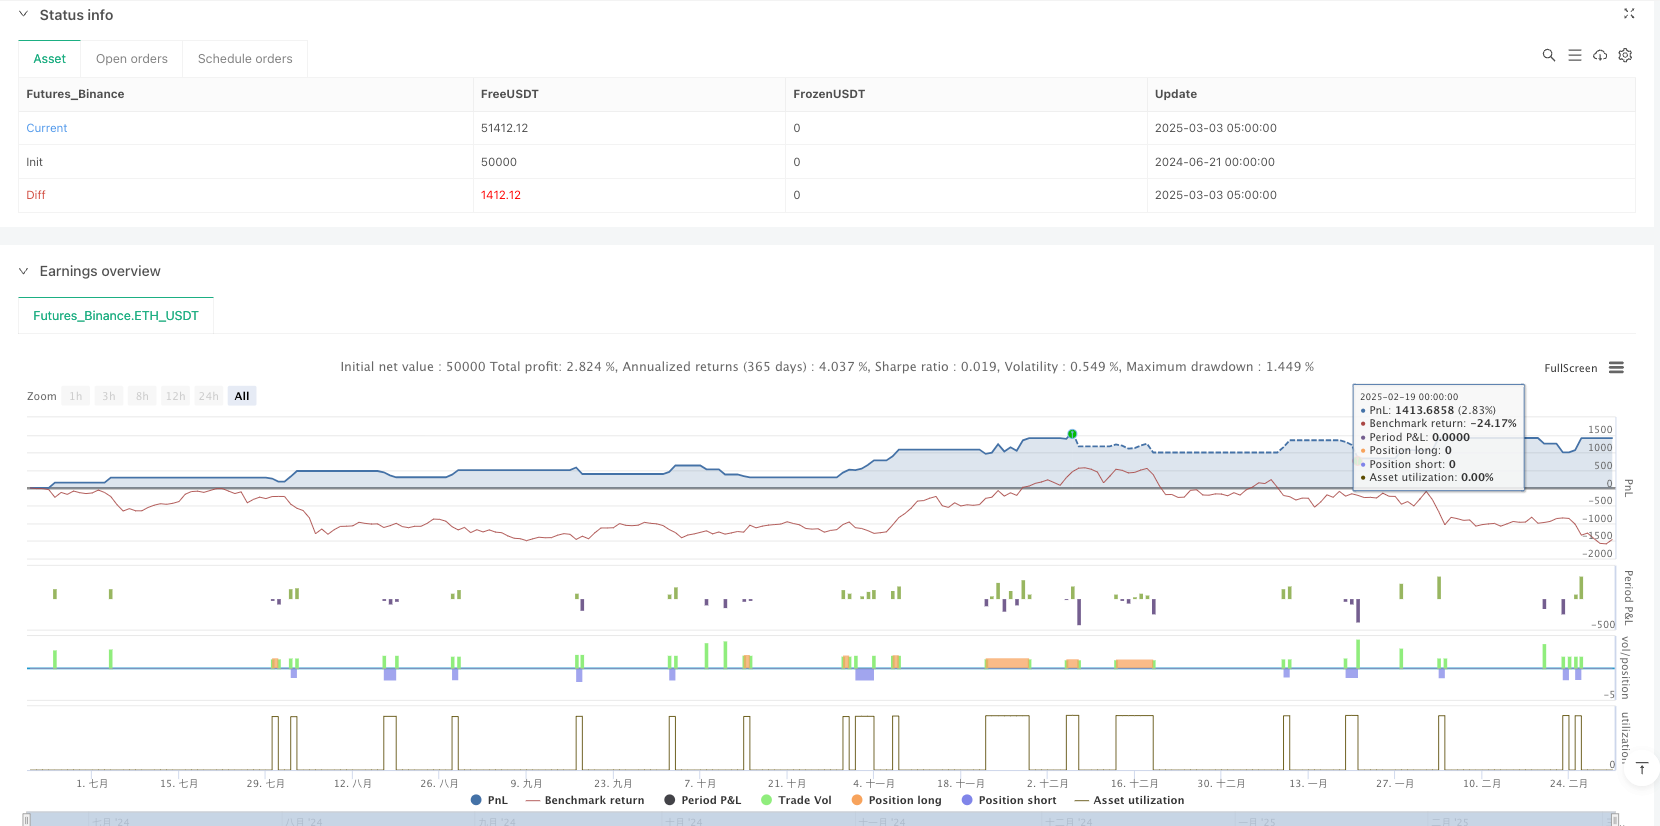

概述
这是一个基于多重指标确认的量化交易策略,核心指标为超级趋势线(SuperTrend),同时结合200日指数移动平均线(EMA)作为趋势确认,相对强弱指数(RSI)作为动量确认,并通过平均真实波幅(ATR)动态设置止损和止盈水平。该策略采用多层过滤机制,确保交易信号的可靠性,同时通过灵活的风险管理系统保护资金安全。策略设计遵循趋势跟踪原则,通过多重指标协同验证,提高交易成功率。
策略原理
该策略的核心原理是通过多层指标协同确认,过滤掉低质量交易信号,同时动态管理风险:
超级趋势线(SuperTrend)信号识别:
- 利用SuperTrend指标(基于ATR的趋势跟踪指标)识别价格突破
- 当价格向上突破超级趋势线时产生买入信号基础
- 当价格向下跌破超级趋势线时产生卖出信号基础
趋势确认机制:
- 使用200日EMA确认中长期趋势方向
- 买入条件要求价格必须位于EMA之上,确保顺应上升趋势
- 卖出条件要求价格必须位于EMA之下,确保顺应下降趋势
动量确认过滤:
- 通过RSI指标验证市场动量
- 买入信号要求RSI大于50,确认上升动量
- 卖出信号要求RSI小于50,确认下降动量
- 可选择是否启用RSI过滤功能
动态风险管理:
- 基于ATR动态设置止损位置,自适应市场波动性
- 买入交易止损设置为:当前价格 - (ATR乘数 × ATR值)
- 卖出交易止损设置为:当前价格 + (ATR乘数 × ATR值)
风险回报比例控制:
- 通过固定乘数关系设置止盈目标
- 止盈水平根据止损距离自动计算,默认风险回报比为1:2
策略交易逻辑清晰:只有当SuperTrend给出信号,且同时满足趋势方向(EMA)和市场动量(RSI可选)条件时,才执行交易。进场后,系统会根据当前市场波动性自动设置止损和止盈水平,保障风险管理的有效性。
策略优势
多重确认过滤机制:
- 通过SuperTrend、EMA和RSI三重指标确认,有效降低虚假信号
- 多层过滤确保只在高概率趋势环境中交易
- 可以显著减少震荡市场中的亏损交易
自适应市场波动性:
- 基于ATR的止损设置能够自动适应不同市场条件下的波动
- 高波动期间自动扩大止损距离,低波动期间自动收窄止损距离
- 避免了固定止损造成的过早出局或风险过大问题
风险管理完善:
- 每笔交易自动设置止损和止盈,无需手动监控
- 通过比例控制(默认1:2)确保良好的风险回报比
- 系统化的风险控制降低情绪干扰
策略参数灵活可调:
- 所有关键参数均可自定义,适应不同市场和个人风险偏好
- 可选择性启用或禁用RSI过滤,调整策略严格程度
- ATR乘数和止盈比例可根据不同市场特性进行优化
可视化交易信号:
- 策略提供清晰的图形化指标和交易信号标记
- 超级趋势线颜色变化直观显示市场趋势状态
- 买卖信号通过箭头明确标注,便于回测分析
资金管理合理:
- 默认每笔交易使用账户总值的固定比例(10%),而非固定合约数量
- 随着账户规模变化自动调整头寸大小,实现复利效应
- 避免了固定手数交易可能带来的资金管理问题
策略风险
趋势转折点反应滞后:
- SuperTrend和EMA都属于滞后性指标,在趋势转折点可能反应不及时
- 在急剧反转市场中可能面临较大回撤
- 缓解方法:可考虑增加短期动量指标或波动率突破检测机制
横盘震荡市场表现不佳:
- 策略设计基于趋势跟踪理念,在无明确趋势的横盘市场可能频繁进出
- 震荡市场可能产生连续亏损交易
- 缓解方法:增加趋势强度过滤或在识别到震荡市场时暂停交易
固定RSI阈值局限性:
- 使用固定的RSI阈值(50)可能不适用于所有市场环境
- 在某些偏向性市场中,RSI长期维持在高区或低区
- 缓解方法:考虑使用自适应RSI阈值或RSI变化率而非绝对水平
止损设置风险:
- 虽然基于ATR的动态止损有优势,但在极端波动市场中可能设置过宽
- 黑天鹅事件可能直接突破止损水平
- 缓解方法:增加最大止损限制或设置波动率异常检测机制
过度优化风险:
- 策略具有多个可调参数,存在过度拟合历史数据的风险
- 优化后的参数组合可能不适用于未来市场
- 缓解方法:采用步进式前向测试或分段验证参数稳健性
资金管理考量:
- 默认使用账户10%的比例可能在某些情况下风险过高
- 连续亏损可能对资金造成较大影响
- 缓解方法:根据策略回测表现和个人风险承受能力调整头寸比例
策略优化方向
增加市场环境适应性:
- 开发市场类型识别功能,区分趋势市场和震荡市场
- 在不同市场环境中动态调整交易参数
- 理由:提高策略在多种市场条件下的适应性,减少震荡市场中的虚假信号
引入动态参数调整:
- 根据市场波动性自动调整SuperTrend因子
- 高波动市场增加因子值,低波动市场减小因子值
- 理由:避免参数固定带来的局限性,提高策略对市场变化的响应能力
优化RSI应用方式:
- 将RSI固定阈值替换为动态阈值或趋势线突破
- 考虑RSI背离信号作为辅助指标
- 理由:提高RSI指标在不同市场环境下的有效性,增加策略的稳健性
完善风险管理系统:
- 增加最大承受回撤控制
- 实现基于波动率的头寸动态调整
- 引入复合止损策略(跟踪止损+固定止损)
- 理由:多层次风险控制可以更好地保护资金,提高长期生存能力
增加时间过滤机制:
- 添加交易时间窗口限制,避开低流动性时段
- 考虑日内波动模式分析
- 理由:避免在不利交易时段产生信号,提高执行质量和减少滑点
增强信号质量评估:
- 开发信号强度评分系统,综合多项指标
- 基于信号质量动态调整头寸大小
- 理由:区分高质量和低质量信号,提高资金配置效率
考虑增加机器学习组件:
- 使用机器学习方法优化参数组合
- 探索使用神经网络预测信号可靠性
- 理由:现代算法可以挖掘传统技术指标无法捕捉的市场规律
总结
多重指标趋势确认动态止盈止损交易策略是一个结构完善、逻辑清晰的量化交易系统。它通过SuperTrend、EMA和RSI三重指标确认,形成可靠的交易信号,同时利用基于ATR的动态风险管理机制控制每笔交易的风险。
该策略的核心优势在于多层过滤机制减少了虚假信号,自适应的止损设置能够应对不同的市场波动环境,完善的风险管理系统保障了资金安全。策略参数设计灵活可调,使用者可以根据不同市场特性和个人风险偏好进行定制。
然而,策略也存在趋势转折点反应滞后、横盘震荡市场表现不佳等固有风险。未来优化方向可考虑增加市场环境识别功能,实现参数动态调整,完善RSI应用方式,加强风险管理系统,以及增加信号质量评估机制等。
总体而言,这是一个平衡了信号质量和风险控制的全面策略系统,适合偏好趋势跟踪的交易者。通过持续优化和完善,该策略有潜力成为一个长期稳定盈利的交易系统。
/*backtest
start: 2024-06-21 00:00:00
end: 2025-03-03 08:00:00
period: 3h
basePeriod: 3h
exchanges: [{"eid":"Futures_Binance","currency":"ETH_USDT"}]
*/

//@version=6
strategy("Super Trend with EMA, RSI & Signals", overlay=true, default_qty_type=strategy.percent_of_equity, default_qty_value=10)

// Super Trend Indicator
atrLength = input.int(10, title="ATR Length")
factor = input.float(3.0, title="Super Trend Multiplier")
[st, direction] = ta.supertrend(factor, atrLength)

// 200 EMA for Trend Confirmation
emaLength = input.int(200, title="EMA Length")
ema200 = ta.ema(close, emaLength)

// RSI for Momentum Confirmation
rsiLength = input.int(14, title="RSI Length")
rsi = ta.rsi(close, rsiLength)
useRSIFilter = input.bool(true, title="Use RSI Filter?")
rsiThreshold = 50

// Buy & Sell Conditions
buyCondition = ta.crossover(close, st) and close > ema200 and (not useRSIFilter or rsi > rsiThreshold)
sellCondition = ta.crossunder(close, st) and close < ema200 and (not useRSIFilter or rsi < rsiThreshold)

// Stop Loss & Take Profit (Based on ATR)
atrMultiplier = input.float(1.5, title="ATR Stop Loss Multiplier")
atrValue = ta.atr(atrLength)
stopLossBuy = close - (atrMultiplier * atrValue)
stopLossSell = close + (atrMultiplier * atrValue)
takeProfitMultiplier = input.float(2.0, title="Take Profit Multiplier")
takeProfitBuy = close + (takeProfitMultiplier * (close - stopLossBuy))
takeProfitSell = close - (takeProfitMultiplier * (stopLossSell - close))

// Execute Trades
if buyCondition
    strategy.entry("Buy", strategy.long)
    strategy.exit("Take Profit Buy", from_entry="Buy", limit=takeProfitBuy, stop=stopLossBuy)

if sellCondition
    strategy.entry("Sell", strategy.short)
    strategy.exit("Take Profit Sell", from_entry="Sell", limit=takeProfitSell, stop=stopLossSell)

// Plot Indicators
plot(ema200, title="200 EMA", color=color.blue, linewidth=2)
plot(st, title="Super Trend", color=(direction == 1 ? color.green : color.red), style=plot.style_stepline)

// Plot Buy & Sell Signals as Arrows
plotshape(series=buyCondition, location=location.belowbar, color=color.green, style=shape.labelup, title="Buy Signal", text="BUY")
plotshape(series=sellCondition, location=location.abovebar, color=color.red, style=shape.labeldown, title="Sell Signal", text="SELL")