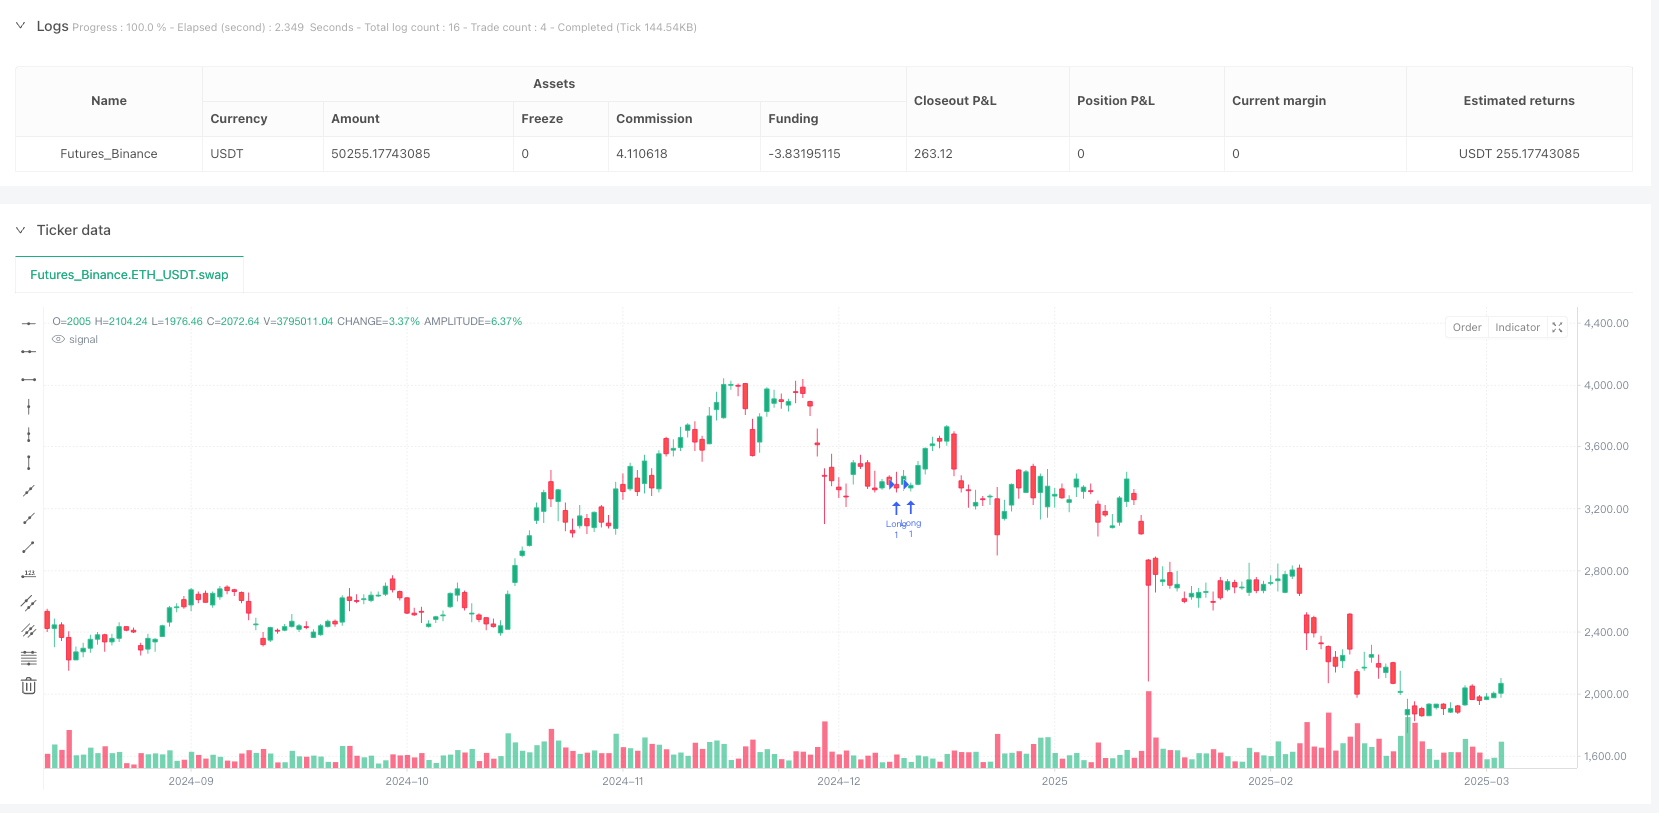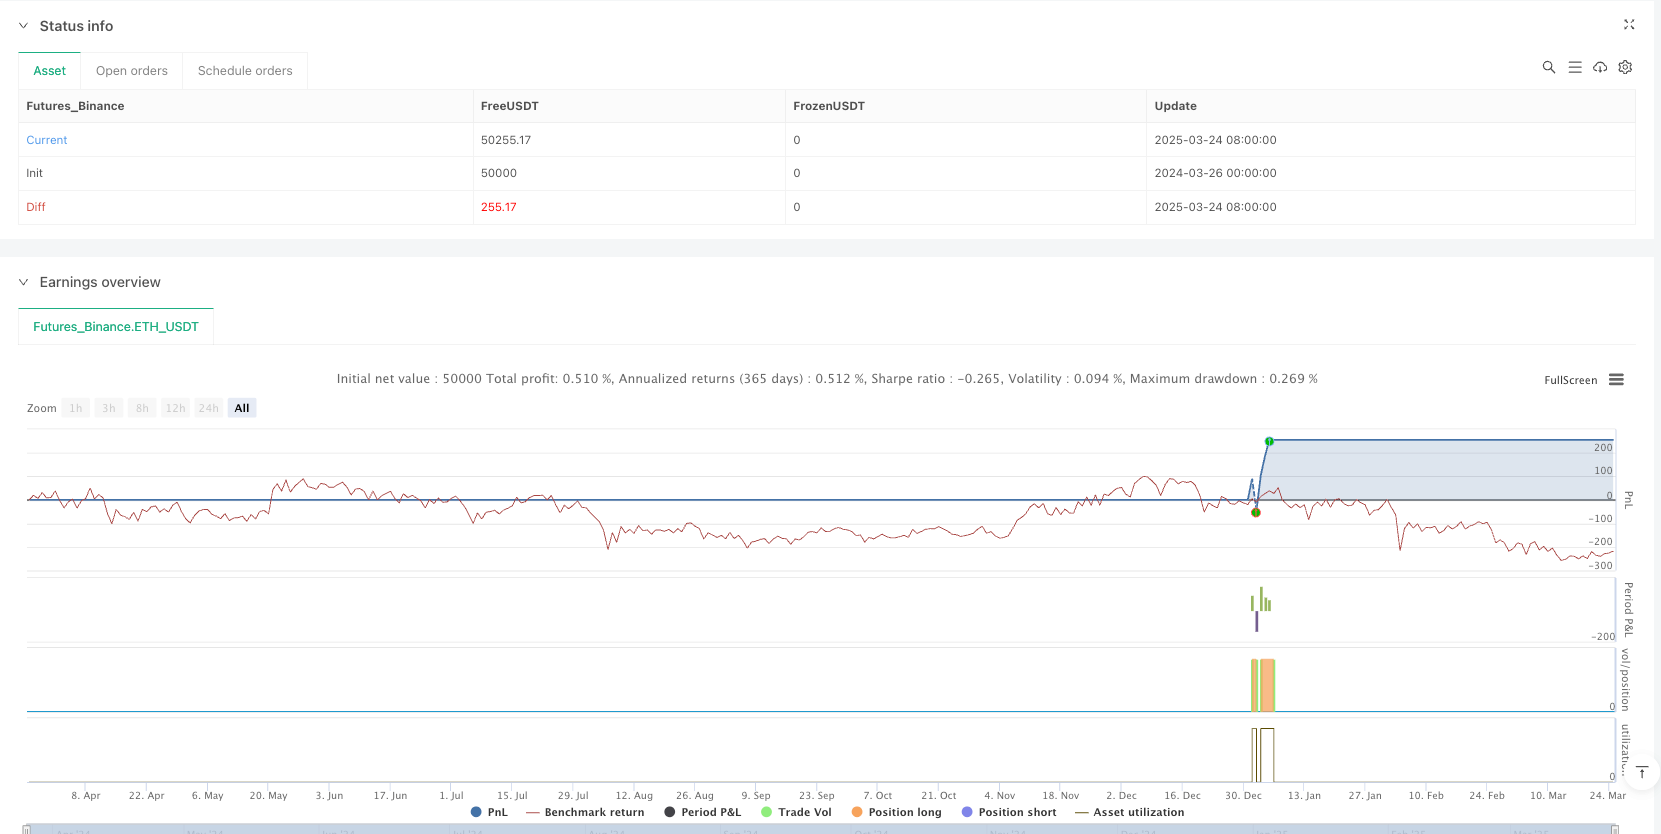

概述
相似矩形高度模式量化策略是一种基于价格波动特征的交易系统,该策略通过识别市场中具有相似高度的矩形形态来捕捉潜在的交易机会。策略核心在于寻找价格波动幅度相似的模式,并结合RSI指标、成交量确认以及动态调整的止损止盈位来管理风险和优化交易结果。该策略适用于各种交易品种,通过精确计算价格高度比例关系,为交易者提供了一种系统化的方法来识别可能的趋势反转或延续信号。
策略原理
该策略的核心原理是基于价格形态的几何特性分析,主要围绕以下几个关键点展开:
高度模式识别:策略主要关注两种类型的高度模式 - 主要高度(由用户自定义的价格百分比)和回调高度(同样由用户定义的较小百分比)。系统会动态计算这些高度值,以适应不同的市场条件。
多重模式检测:
- 牛市模式:识别底部形成后出现特定高度上涨的形态
- 熊市模式:识别顶部形成后出现特定高度下跌的形态
- 牛市回调:在上升趋势中识别特定幅度的回调
- 熊市回调:在下降趋势中识别特定幅度的反弹
参数优化:
- 回看周期(lookbackPeriod):决定分析的历史数据范围
- 模式宽度限制:通过最小和最大宽度参数控制形态的时间跨度
- 高度匹配容差:允许实际高度与理想高度有20%的偏差,增加模式识别的灵活性
技术指标过滤:
- RSI指标:可选择性地使用RSI超买超卖水平来过滤交易信号
- 成交量确认:可选择性地要求交易信号在成交量高于平均水平时才有效
入场与出场策略:
- 入场信号:当检测到牛市模式或牛市回调时做多,检测到熊市模式或熊市回调时做空
- 出场策略:使用回调高度设置止损,使用主要高度设置止盈,形成风险回报比例明确的交易系统
策略优势
通过深入分析代码实现,该策略展现出以下显著优势:
客观的信号生成机制:基于数学计算和明确定义的几何关系,减少了主观判断的影响,使交易决策更加系统化和一致。
自适应市场条件:通过使用平均价格的百分比计算高度参数,策略能够自动适应不同价格区间和波动性的市场环境。
多维度确认机制:结合形态识别、RSI指标和成交量分析,提供了多层次的信号确认,有助于过滤低质量交易信号。
明确的风险管理框架:每笔交易都有预先定义的止损和止盈位置,帮助交易者控制风险并保持一致的风险回报比。
可视化辅助:通过在图表上绘制矩形和标签,直观展示识别到的交易模式,便于交易者理解和验证信号。
参数化设计:策略提供了多个可调整参数,允许交易者根据特定市场条件和个人风险偏好进行优化。
多种模式识别:不仅能识别主要趋势的形成,还能捕捉趋势中的回调机会,提供更多的交易入场点。
策略风险
尽管该策略具有诸多优势,但仍存在以下潜在风险:
参数敏感性:策略表现高度依赖于参数设置,不当的参数可能导致过度交易或错过重要信号。解决方法是通过历史回测寻找最优参数组合,并定期重新评估参数有效性。
假突破风险:市场可能形成类似预期模式的形态但随后反转,导致错误信号。建议增加确认机制,如等待收盘价确认或结合其他指标进行交叉验证。
固定百分比局限性:使用固定百分比计算高度可能不适用于波动性急剧变化的市场。可以考虑引入基于ATR或历史波动率的动态高度计算方法。
计算密集型处理:策略涉及多重循环和条件判断,在处理大量数据时可能导致性能问题。优化代码结构或简化某些计算步骤可以提高执行效率。
趋势判断简化:当前趋势判断仅基于移动平均线的简单比较,可能无法准确捕捉复杂的市场结构。考虑整合更复杂的趋势识别算法来提高准确性。
止损止盈静态设置:固定使用回调高度和主要高度作为止损和止盈可能不够灵活。可以引入基于市场波动性或支撑阻力位的动态止损止盈机制。
策略优化方向
基于代码分析,以下是该策略可能的优化方向:
动态参数调整:引入自适应参数机制,根据市场波动性和交易周期自动调整高度百分比和模式宽度参数。这样可以更好地适应不同市场阶段的特性。
增强趋势确认:整合更复杂的趋势识别方法,如多周期趋势分析、布林带宽度变化或方向移动指数(DMI),以提高趋势判断的准确性。
优化信号过滤:引入额外的过滤条件,如价格与移动平均线的位置关系、多周期RSI一致性分析或成交量分布特征,减少假信号。
改进回测评估:增加更全面的策略评估指标,如最大回撤、夏普比率、盈亏因子等,以全面评估策略性能并指导参数优化。
自适应止损机制:基于ATR或近期波动性动态调整止损水平,而不是简单使用固定的回调高度,提高风险管理的有效性。
整合市场环境分析:添加市场环境分类功能,在不同的市场状态(如高波动性、低波动性、强趋势或区间震荡)下采用不同的参数设置或交易逻辑。
优化执行效率:重构模式识别算法,减少嵌套循环和重复计算,提高策略在实时环境中的执行速度。
增加时间过滤:添加基于时间的过滤条件,避开市场开盘、收盘或重要新闻发布等波动剧烈的时段,提高信号质量。
总结
相似矩形高度模式量化策略是一种独特的技术分析方法,通过精确定义和识别价格波动的几何特性来捕捉交易机会。其核心创新在于将抽象的图表模式转化为可量化的数学关系,并结合技术指标进行多重确认。策略提供了完整的交易框架,包括入场信号生成、风险管理和图形化展示,适合追求系统化交易方法的交易者。
虽然该策略提供了一种新颖的角度来分析市场,但其效果很大程度上取决于参数优化和市场适应性。通过持续改进信号过滤机制、增强趋势判断准确性和优化风险管理方法,该策略有潜力成为交易者工具箱中的有效工具。最重要的是,交易者应该在实盘应用前进行充分的历史回测和模拟交易,确保策略与个人交易风格和风险承受能力相匹配。
/*backtest
start: 2024-03-26 00:00:00
end: 2025-03-25 00:00:00
period: 1d
basePeriod: 1d
exchanges: [{"eid":"Futures_Binance","currency":"ETH_USDT"}]
*/

//@version=5
strategy("Similar Rectangle Heights - Strategy", overlay=true)

// Strategy parameters
lookbackPeriod = input.int(45, "Analysis period", minval=10)
primaryHeightPercent = input.float(5.0, "Primary height (% of price)", minval=0.5, maxval=20.0, step=0.5)
correctionHeightPercent = input.float(2.2, "Correction height (% of price)", minval=0.5, maxval=10.0, step=0.5)
minPatternBars = input.int(5, "Minimum pattern width (candles)", minval=3)
maxPatternBars = input.int(14, "Maximum pattern width (candles)", minval=5)
useVolume = input.bool(false, "Include volume")
useRSI = input.bool(true, "Include RSI")
rsiPeriod = input.int(23, "RSI period", minval=5)
rsiOverbought = input.int(55, "RSI overbought level", minval=50, maxval=90)
rsiOversold = input.int(50, "RSI oversold level", minval=10, maxval=50)

// Calculate primary height and correction height in price points
avgPrice = ta.sma(close, lookbackPeriod)
primaryHeight = avgPrice * primaryHeightPercent / 100
correctionHeight = avgPrice * correctionHeightPercent / 100

// Calculate RSI
rsi = ta.rsi(close, rsiPeriod)

// Function to detect a bullish pattern
bullishPattern(idx) =>
    // Check if there is a low followed by a rise of a specified height
    lowestLow = ta.lowest(low, minPatternBars)[idx]
    highAfterLow = ta.highest(high, minPatternBars)[idx]
    patternHeight = highAfterLow - lowestLow

    // Check if pattern height matches the primary height
    heightMatch = math.abs(patternHeight - primaryHeight) <= primaryHeight * 0.2

    // Check if pattern width is within range
    patternWidth = 0
    for i = 0 to maxPatternBars - 1
        if idx + i < lookbackPeriod and low[idx + i] == lowestLow
            for j = i to maxPatternBars - 1
                if idx + j < lookbackPeriod and high[idx + j] == highAfterLow
                    patternWidth := j - i + 1
                    break
            break

    widthMatch = patternWidth >= minPatternBars and patternWidth <= maxPatternBars

    // Check volume and RSI conditions
    volumeCondition = not useVolume or volume > ta.sma(volume, lookbackPeriod)
    rsiCondition = not useRSI or rsi[idx] < rsiOversold

    // Return true if all conditions are met
    heightMatch and widthMatch and volumeCondition and rsiCondition

// Function to detect a bearish pattern
bearishPattern(idx) =>
    // Check if there is a high followed by a drop of a specified height
    highestHigh = ta.highest(high, minPatternBars)[idx]
    lowAfterHigh = ta.lowest(low, minPatternBars)[idx]
    patternHeight = highestHigh - lowAfterHigh

    // Check if pattern height matches the primary height
    heightMatch = math.abs(patternHeight - primaryHeight) <= primaryHeight * 0.2

    // Check if pattern width is within range
    patternWidth = 0
    for i = 0 to maxPatternBars - 1
        if idx + i < lookbackPeriod and high[idx + i] == highestHigh
            for j = i to maxPatternBars - 1
                if idx + j < lookbackPeriod and low[idx + j] == lowAfterHigh
                    patternWidth := j - i + 1
                    break
            break

    widthMatch = patternWidth >= minPatternBars and patternWidth <= maxPatternBars

    // Check volume and RSI conditions
    volumeCondition = not useVolume or volume > ta.sma(volume, lookbackPeriod)
    rsiCondition = not useRSI or rsi[idx] > rsiOverbought

    // Return true if all conditions are met
    heightMatch and widthMatch and volumeCondition and rsiCondition

// Function to detect a bullish correction in an uptrend
bullishCorrection(idx) =>
    // Check if there is a pullback of correction height after a rise
    highBeforeCorrection = ta.highest(high, minPatternBars)[idx]
    lowDuringCorrection = ta.lowest(low, minPatternBars)[idx]
    correctionSize = highBeforeCorrection - lowDuringCorrection

    // Check if correction height matches expected height
    heightMatch = math.abs(correctionSize - correctionHeight) <= correctionHeight * 0.2

    // Check if correction width is within range
    correctionWidth = 0
    for i = 0 to maxPatternBars - 1
        if idx + i < lookbackPeriod and high[idx + i] == highBeforeCorrection
            for j = i to maxPatternBars - 1
                if idx + j < lookbackPeriod and low[idx + j] == lowDuringCorrection
                    correctionWidth := j - i + 1
                    break
            break

    widthMatch = correctionWidth >= minPatternBars / 2 and correctionWidth <= maxPatternBars / 2

    // Check if we are in an uptrend
    uptrend = ta.sma(close, lookbackPeriod)[idx] > ta.sma(close, lookbackPeriod)[idx + minPatternBars]

    // Return true if all conditions are met
    heightMatch and widthMatch and uptrend

// Function to detect a bearish correction in a downtrend
bearishCorrection(idx) =>
    // Check if there is a pullback of correction height after a drop
    lowBeforeCorrection = ta.lowest(low, minPatternBars)[idx]
    highDuringCorrection = ta.highest(high, minPatternBars)[idx]
    correctionSize = highDuringCorrection - lowBeforeCorrection

    // Check if correction height matches expected height
    heightMatch = math.abs(correctionSize - correctionHeight) <= correctionHeight * 0.2

    // Check if correction width is within range
    correctionWidth = 0
    for i = 0 to maxPatternBars - 1
        if idx + i < lookbackPeriod and low[idx + i] == lowBeforeCorrection
            for j = i to maxPatternBars - 1
                if idx + j < lookbackPeriod and high[idx + j] == highDuringCorrection
                    correctionWidth := j - i + 1
                    break
            break

    widthMatch = correctionWidth >= minPatternBars / 2 and correctionWidth <= maxPatternBars / 2

    // Check if we are in a downtrend
    downtrend = ta.sma(close, lookbackPeriod)[idx] < ta.sma(close, lookbackPeriod)[idx + minPatternBars]

    // Return true if all conditions are met
    heightMatch and widthMatch and downtrend

// Detecting signals
var float entryPrice = na
var float stopLoss = na
var float takeProfit = na

// Buy signal
buySignal = false
for i = 0 to 3
    if bullishPattern(i) or (i > 0 and bullishCorrection(i))
        buySignal := true
        break

// Sell signal
sellSignal = false
for i = 0 to 3
    if bearishPattern(i) or (i > 0 and bearishCorrection(i))
        sellSignal := true
        break

// Execute strategy
if buySignal
    entryPrice := close
    stopLoss := close - correctionHeight
    takeProfit := close + primaryHeight
    strategy.entry("Long", strategy.long)
    strategy.exit("Exit Long", "Long", stop=stopLoss, limit=takeProfit)

if sellSignal
    entryPrice := close
    stopLoss := close + correctionHeight
    takeProfit := close - primaryHeight
    strategy.entry("Short", strategy.short)
    strategy.exit("Exit Short", "Short", stop=stopLoss, limit=takeProfit)