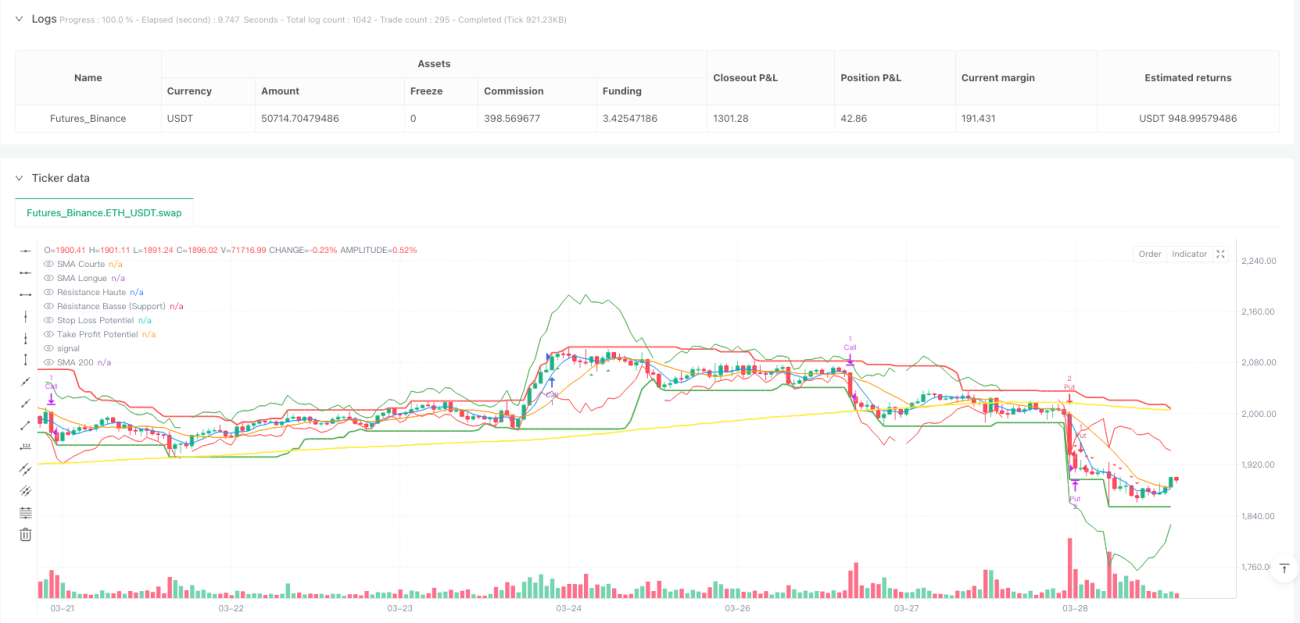
本策略是一种多维度短期趋势预测策略,专注于利用多个技术指标的协同效应来识别和预测金融市场中的短期趋势变化。该策略整合了简单移动平均线(SMA)、相对强弱指数(RSI)、平均方向指数(ADX)、平均真实波动范围(ATR)、移动平均线差指标(MACD)和随机振荡器(Stochastic)等关键技术分析工具,旨在提高交易信号的准确性和可靠性。
该策略的核心原理基于多重技术指标的协同分析和趋势确认机制。通过综合考虑以下关键因素来生成交易信号:
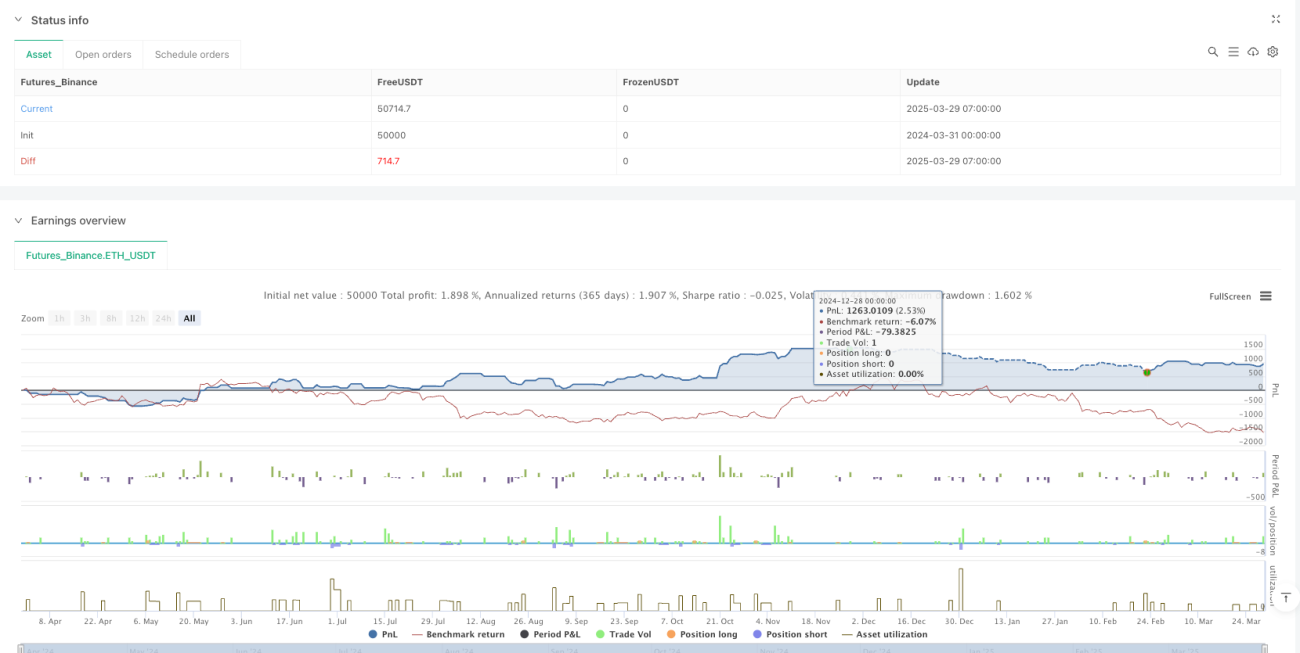
策略通过动态计算潜在入场点、止损和止盈水平,并根据最近的市场波动性调整这些关键参数,从而实现风险管理和交易执行。
这是一种多维度、数据驱动的短期趋势预测策略,通过复杂的技术指标组合和动态风险管理机制,旨在提高交易决策的准确性和可靠性。尽管策略具有显著的理论优势,但实际应用中仍需谨慎,并持续进行回测和优化。
/*backtest
start: 2024-03-31 00:00:00
end: 2025-03-29 08:00:00
period: 1h
basePeriod: 1h
exchanges: [{"eid":"Futures_Binance","currency":"ETH_USDT"}]
*/
// © HugoMora
//@version=5
strategy("Short-Term Trend Predictor: Call/Put (5min to 4hr)", overlay=true)
// --- 1. Paramètres (Inputs) ---
// Info-bulle pour short_length
short_length = input.int(5, title="Période SMA Courte", minval=1, tooltip = "Période de la moyenne mobile courte. Utilisée pour identifier les tendances à court terme.")
long_length = input.int(13, title="Période SMA Longue", minval=1, tooltip = "Période de la moyenne mobile longue. Utilisée pour confirmer les tendances à plus long terme.")
rsi_length = input.int(14, title="Période RSI", minval=1, tooltip = "Période de l'indice de force relative (RSI). Mesure la vitesse et l'ampleur des mouvements de prix récents pour évaluer les conditions de surachat ou de survente.")
sma200_length = input.int(200, title="Période SMA 200", minval=1, tooltip = "Période de la moyenne mobile sur 200 périodes. Utilisée pour déterminer la tendance générale du marché (haussière ou baissière).")
resistance_length = input.int(20, title="Période Résistance", minval=1, tooltip="Nombre de périodes utilisées pour calculer les niveaux de résistance et de support.")
macd_fast = input.int(12, title="Longueur Rapide MACD", tooltip = "Période plus courte utilisée dans le calcul de la ligne MACD. Représente les mouvements de prix à court terme.")
macd_slow = input.int(26, title="Longueur Lente MACD", tooltip = "Période plus longue utilisée dans le calcul de la ligne MACD. Représente les mouvements de prix à long terme.")
macd_signal = input.int(9, title="Période Signal MACD", tooltip = "Période de la SMA de la ligne MACD, utilisée comme signal d'achat ou de vente.")
stoch_k = input.int(14, title="Longueur %K Stoch", tooltip = "Période utilisée pour calculer la ligne %K du Stochastic Oscillator, indiquant où le prix de clôture se situe par rapport à la fourchette haute-basse sur cette période.")
stoch_d = input.int(3, title="Longueur %D Stoch", tooltip = "Période utilisée pour calculer la ligne %D, qui est une moyenne mobile de %K. Utilisée pour lisser les fluctuations de %K.")
adx_length = input.int(14, title="Longueur ADX", tooltip = "Période utilisée pour calculer l'Average Directional Index (ADX), qui mesure la force de la tendance.")
adx_smooth = input.int(14, title="Lissage ADX", tooltip = "Période utilisée pour lisser la ligne ADX, réduisant le bruit et fournissant une mesure plus stable de la force de la tendance.")
atrLength = input.int(14, title="Longueur ATR", tooltip = "Période utilisée pour calculer l'Average True Range (ATR), qui mesure la volatilité du marché.")
atrMultiplierSL = input.float(2.0, title="Multiplicateur ATR Stop Loss", minval=0.1, tooltip = "Multiplicateur de l'ATR pour déterminer le niveau de Stop Loss. Un multiplicateur plus élevé signifie un Stop Loss plus éloigné du prix d'entrée.")
atrMultiplierTP = input.float(2.0, title="Multiplicateur ATR Take Profit", minval=0.1, tooltip = "Multiplicateur de l'ATR pour déterminer le niveau de Take Profit. Un multiplicateur plus élevé signifie un Take Profit plus éloigné du prix d'entrée.")
takeProfitRiskRatio = input.float(2.0, title="Ratio Take Profit/Risque", minval=0.1, tooltip = "Ratio du Take Profit par rapport au risque (Stop Loss). Par exemple, un ratio de 2 signifie que le Take Profit est deux fois plus éloigné que le Stop Loss.")
volatility_lookback = input.int(20, title="Volatilité Récente (Périodes)", minval=5, tooltip="Nombre de périodes utilisées pour calculer la volatilité récente du marché, mesurée par l'écart-type des prix de clôture.") // Paramètre pour la volatilité
initialCapital = input.float(100, title="Capital Initial (€)", minval=1, tooltip = "Capital initial utilisé pour le backtest de la stratégie.") // Capital initial de 100€
riskPerTrade = input.float(1.0, title="Risque par Trade (%)", minval=0.01, maxval=1.0, tooltip = "Pourcentage du capital initial risqué par trade. Utilisé pour calculer la taille de la position.") // Risk is 100% of available capital
leverage = input.int(1, title="Levier", minval=1, tooltip = "Effet de levier appliqué aux trades. Multiplie les profits et les pertes.") // Add leverage input
// --- 2. Calcul des Indicateurs et des Résistances ---
sma_short = ta.sma(close, short_length)
sma_long = ta.sma(close, long_length)
rsi = ta.rsi(close, rsi_length)
sma200 = ta.sma(close, sma200_length)
isUptrend = ta.rising(sma200, 5)
isDowntrend = ta.falling(sma200, 5)
resistance_high = ta.highest(high, resistance_length)
resistance_low = ta.lowest(low, resistance_length)
[macdLine, signalLine, hist] = ta.macd(close, macd_fast, macd_slow, macd_signal)
stochK = ta.stoch(close, high, low, stoch_k)
stochD = ta.sma(stochK, stoch_d)
[diPlus, diMinus, adx] = ta.dmi(adx_length, adx_smooth)
atrValue = ta.atr(atrLength)
// Calcul de la volatilité récente (écart-type des prix)
recentVolatility = ta.stdev(close, volatility_lookback)
// --- 3. Détection des Croisements et Conditions ---
short_above_long = sma_short > sma_long and macdLine > signalLine and stochK > stochD and adx > 25 and diPlus > diMinus
short_below_long = sma_short < sma_long and macdLine < signalLine and stochK < stochD and adx > 25 and diMinus > diPlus // Modified stochK < stochD
long_enter = ta.crossover(sma_short,sma_long)
short_enter = ta.crossunder(sma_short,sma_long)
// --- 4. Analyse de Tendance et Recommandations et Points d'Entrée/Sortie Potentiels ---
var string tendance = ""
var color tendance_couleur = color.gray // Couleur neutre par défaut
var float potentialEntry = na
var float potentialStopLoss = na
var float potentialTakeProfit = na
if (isUptrend and short_above_long)
tendance := "Haussier Fort (Call)"
tendance_couleur := color.green
potentialEntry := high
// Utilisation de la volatilité récente pour le Stop Loss et le Take Profit
potentialStopLoss := potentialEntry - (recentVolatility * atrMultiplierSL)
potentialTakeProfit := potentialEntry + (recentVolatility * atrMultiplierTP)
else if (isUptrend and not short_above_long and not short_below_long) // Added check to prevent both conditions being true
tendance := "Haussier Modéré (Call)"
tendance_couleur := color.lime
potentialEntry := high
potentialStopLoss := potentialEntry - (recentVolatility * atrMultiplierSL)
potentialTakeProfit := potentialEntry + (recentVolatility * atrMultiplierTP)
else if (isDowntrend and short_below_long)
tendance := "Baissier Fort (Put)"
tendance_couleur := color.red
potentialEntry := low
potentialStopLoss := potentialEntry + (recentVolatility * atrMultiplierSL)
potentialTakeProfit := potentialEntry - (recentVolatility * atrMultiplierTP)
else if (isDowntrend and not short_below_long and not short_above_long) // Added check to prevent both conditions being true
tendance := "Baissier Modéré (Put)"
tendance_couleur := color.orange
potentialEntry := low
potentialStopLoss := potentialEntry + (recentVolatility * atrMultiplierSL)
potentialTakeProfit := potentialEntry - (recentVolatility * atrMultiplierTP)
else
tendance := "Neutre"
tendance_couleur := color.gray
potentialEntry := na
potentialStopLoss := na
potentialTakeProfit := na
// --- 5. Affichage de la Tendance (Label Persistant) ---
var label tendance_label = na
if (barstate.islast)
if (na(tendance_label))
tendance_label := label.new(bar_index, high, text="Tendance: " + tendance, color=tendance_couleur, textcolor=color.white, style=label.style_label_down, yloc=yloc.abovebar, y=high*1.02)
label.set_tooltip(tendance_label, "Tendance actuelle du marché") // Ajout du tooltip au label
else
label.set_text(tendance_label, "Tendance: " + tendance)
label.set_x(tendance_label, bar_index)
label.set_y(tendance_label, high*1.02)
label.set_color(tendance_label, tendance_couleur)
label.set_tooltip(tendance_label, "Tendance actuelle du marché")
// --- 6. Tableau d'Information ---
var table info_table = table.new(position.top_right, 2, 12, border_width=1) // Ajout d'une ligne pour le capital
var float currentCapital = initialCapital // Declare currentCapital here
table.cell(info_table, 0, 0, "Indicateur", bgcolor=color.gray, text_color=color.white)
table.cell(info_table, 1, 0, "Valeur", bgcolor=color.gray, text_color=color.white)
table.cell(info_table, 0, 1, "SMA Courte", bgcolor=color.white, text_color=color.black)
table.cell(info_table, 1, 1, str.tostring(sma_short, "#.##"), bgcolor=color.white, text_color=color.black)
table.cell_set_tooltip(info_table, 0, 1, "Moyenne mobile courte")
table.cell_set_tooltip(info_table, 1, 1, str.tostring(sma_short, "#.##"))
table.cell(info_table, 0, 2, "SMA Longue", bgcolor=color.white, text_color=color.black)
table.cell(info_table, 1, 2, str.tostring(sma_long, "#.##"), bgcolor=color.white, text_color=color.black)
table.cell_set_tooltip(info_table, 0, 2, "Moyenne mobile longue")
table.cell_set_tooltip(info_table, 1, 2, str.tostring(sma_long, "#.##"))
table.cell(info_table, 0, 3, "RSI", bgcolor=color.white, text_color=color.black)
table.cell(info_table, 1, 3, str.tostring(rsi, "#.##"), bgcolor=color.white, text_color=color.black)
table.cell_set_tooltip(info_table, 0, 3, "Indice de force relative")
table.cell_set_tooltip(info_table, 1, 3, str.tostring(rsi, "#.##"))
table.cell(info_table, 0, 4, "Tendance", bgcolor=color.white, text_color=color.black)
table.cell(info_table, 1, 4, tendance, bgcolor=color.white, text_color=color.black)
table.cell_set_tooltip(info_table, 0, 4, "Tendance actuelle du marché")
table.cell_set_tooltip(info_table, 1, 4, tendance)
table.cell(info_table, 0, 5, "Point d'entrée Potentiel", bgcolor=color.white, text_color=color.black)
table.cell(info_table, 1, 5, str.tostring(potentialEntry, "#.##"), bgcolor=color.white, text_color=color.black)
table.cell_set_tooltip(info_table, 0, 5, "Point d'entrée suggéré pour un trade")
table.cell_set_tooltip(info_table, 1, 5, str.tostring(potentialEntry, "#.##"))
table.cell(info_table, 0, 6, "Stop Loss Potentiel", bgcolor=color.white, text_color=color.black)
table.cell(info_table, 1, 6, str.tostring(potentialStopLoss, "#.##"), bgcolor=color.white, text_color=color.black)
table.cell_set_tooltip(info_table, 0, 6, "Niveau de prix auquel fermer automatiquement une position pour limiter les pertes")
table.cell_set_tooltip(info_table, 1, 6, str.tostring(potentialStopLoss, "#.##"))
table.cell(info_table, 0, 7, "Take Profit Potentiel", bgcolor=color.white, text_color=color.black)
table.cell(info_table, 1, 7, str.tostring(potentialTakeProfit, "#.##"), bgcolor=color.white, text_color=color.black)
table.cell_set_tooltip(info_table, 0, 7, "Niveau de prix auquel fermer automatiquement une position pour sécuriser les profits")
table.cell_set_tooltip(info_table, 1, 7, str.tostring(potentialTakeProfit, "#.##"))
table.cell(info_table, 0, 8, "Résistance Haute", bgcolor=color.white, text_color=color.red)
table.cell(info_table, 1, 8, str.tostring(resistance_high, "#.##"), bgcolor=color.white, text_color=color.red)
table.cell_set_tooltip(info_table, 0, 8, "Niveau de prix auquel on s'attend à ce que la pression vendeuse l'emporte sur la pression acheteuse")
table.cell_set_tooltip(info_table, 1, 8, str.tostring(resistance_high, "#.##"))
table.cell(info_table, 0, 9, "Résistance Basse", bgcolor=color.white, text_color=color.green)
table.cell(info_table, 1, 9, str.tostring(resistance_low, "#.##"), bgcolor=color.white, text_color=color.green)
table.cell_set_tooltip(info_table, 0, 9, "Niveau de prix auquel on s'attend à ce que la pression acheteuse l'emporte sur la pression vendeuse")
table.cell_set_tooltip(info_table, 1, 9, str.tostring(resistance_low, "#.##"))
table.cell(info_table, 0, 10, "ATR", bgcolor=color.white, text_color=color.black)
table.cell(info_table, 1, 10, str.tostring(atrValue, "#.##"), bgcolor=color.white, text_color=color.black)
table.cell_set_tooltip(info_table, 0, 10, "Average True Range")
table.cell_set_tooltip(info_table, 1, 10, str.tostring(atrValue, "#.##"))
table.cell(info_table, 0, 11, "Volatilité Récente", bgcolor=color.white, text_color=color.black)
table.cell(info_table, 1, 11, str.tostring(recentVolatility, "#.##"), bgcolor=color.white, text_color=color.black)
table.cell_set_tooltip(info_table, 0, 11, "Volatilité du marché calculée sur les dernières périodes")
table.cell_set_tooltip(info_table, 1, 11, str.tostring(recentVolatility, "#.##"))
// --- 7. Tracé des Indicateurs et des Résistances ---
plot(sma_short, color=color.blue, title="SMA Courte")
plot(sma_long, color=color.orange, title="SMA Longue")
plot(sma200, color=color.yellow, title="SMA 200", linewidth=2)
plot(resistance_high, color=color.red, title="Résistance Haute", linewidth=2, style=plot.style_linebr)
plot(resistance_low, color=color.green, title="Résistance Basse (Support)", linewidth=2, style=plot.style_linebr)
// --- 8. Tracé des Points d'Entrée et de Sortie Potentiels ---
plotshape(isUptrend and short_above_long, title="Entrée Call Potentielle", style=shape.triangleup, location=location.belowbar, color=color.green, size=size.small, offset=0)
plotshape(isDowntrend and short_below_long, title="Entrée Put Potentielle", style=shape.triangledown, location=location.abovebar, color=color.red, size=size.small, offset=0)
plot(potentialStopLoss, color=color.red, title="Stop Loss Potentiel", linewidth=1, style=plot.style_linebr)
plot(potentialTakeProfit, color=color.green, title="Take Profit Potentiel", linewidth=1, style=plot.style_linebr)
// --- 9. Ajout des Noms des Courbes ---
if barstate.islast
var label_sma_short = label.new(bar_index, sma_short, "SMA Courte", color=color.blue, style=label.style_label_left)
label.set_tooltip(label_sma_short, "Moyenne mobile Courte")
var label_sma_long = label.new(bar_index, sma_long, "SMA Longue", color=color.orange, style=label.style_label_left)
label.set_tooltip(label_sma_long, "Moyenne mobile Longue")
var label_sma200 = label.new(bar_index, sma200, "SMA 200", color=color.yellow, style=label.style_label_left)
label.set_tooltip(label_sma200, "Moyenne mobile 200")
var label_resistance_high = label.new(bar_index, resistance_high, "Résistance Haute", color=color.red, style=label.style_label_left)
label.set_tooltip(label_resistance_high, "Niveau de Résistance Haute")
var label_resistance_low = label.new(bar_index, resistance_low, "Résistance Basse", color=color.green, style=label.style_label_left)
label.set_tooltip(label_resistance_low, "Niveau de Résistance Basse")
// --- 10. Backtest ---
var int tradesCount = 0
var int winningTradesCount = 0
var int losingTradesCount = 0
var float totalProfit = 0.0
var float maxDrawdown = 0.0
var float previousPeak = initialCapital
var int currentPosition = 0 // 0: no position, 1: long (Call), -1: short (Put)
var float entryPrice = 0.0
var float positionSize = 0.0
var float stopLossPrice = 0.0
var float takeProfitPrice = 0.0
var int entryDate = 0
var int exitDate = 0
var float exitPrice = 0.0 // Declare exitPrice here
var float tradeProfit = 0.0
currentCapital := initialCapital // Reset capital at the beginning of the backtest
if (currentPosition == 0) // No open position
if (isUptrend and short_above_long)
// Enter a long position (Call)
tradesCount := tradesCount + 1
entryPrice := potentialEntry
positionSize := math.floor((currentCapital * riskPerTrade * leverage) / (entryPrice - potentialStopLoss)) // Position size based on risk
if (positionSize > 0) // check if positionSize is valid
currentPosition := 1
stopLossPrice := potentialStopLoss
takeProfitPrice := potentialTakeProfit
entryDate := time
strategy.entry("Call", strategy.long, qty=positionSize, comment="Call Entry", stop=stopLossPrice, limit=takeProfitPrice) // Utilisez strategy.entry
else if (isDowntrend and short_below_long)
// Enter a short position (Put)
tradesCount := tradesCount + 1
entryPrice := potentialEntry
positionSize := math.floor((currentCapital * riskPerTrade * leverage) / (potentialStopLoss - entryPrice)) // Position size based on risk
if (positionSize > 0) // check if positionSize is valid
currentPosition := -1
stopLossPrice := potentialStopLoss
takeProfitPrice := potentialTakeProfit
entryDate := time
strategy.entry("Put", strategy.short, qty=positionSize, comment="Put Entry", stop=stopLossPrice, limit=takeProfitPrice) // Utilisez strategy.entry
else if (currentPosition != 0) // There is an open position
if (currentPosition == 1) // Long position (Call)
if (low <= stopLossPrice or high >= takeProfitPrice)
// Exit the long position
exitPrice := low <= stopLossPrice ? stopLossPrice : takeProfitPrice
tradeProfit := positionSize * (exitPrice - entryPrice)
currentCapital := currentCapital + tradeProfit
totalProfit := totalProfit + tradeProfit
if (tradeProfit > 0)
winningTradesCount := winningTradesCount + 1
else
losingTradesCount := losingTradesCount + 1
currentPosition := 0
exitDate := time
strategy.close("Call", comment="Call Exit", qty=positionSize) // Utilisez strategy.close
else if (currentPosition == -1) // Short position (Put)
if (high >= stopLossPrice or low <= takeProfitPrice)
// Exit the short position
exitPrice := high >= stopLossPrice ? stopLossPrice : takeProfitPrice
tradeProfit := positionSize * (entryPrice - exitPrice) // Short position profit
currentCapital := currentCapital + tradeProfit
totalProfit := totalProfit + tradeProfit
if (tradeProfit > 0)
winningTradesCount := winningTradesCount + 1
else
losingTradesCount := losingTradesCount + 1
currentPosition := 0
exitDate := time
strategy.close("Put", comment="Put Exit", qty=positionSize) // Utilisez strategy.close
// --- 11. Calcul des métriques de performance ---
if (currentCapital > previousPeak)
previousPeak := currentCapital
var float drawdown = 0.0
drawdown := previousPeak - currentCapital
if (drawdown > maxDrawdown)
maxDrawdown := drawdown
var float winRate = 0.0
var float averageProfit = 0.0
var float averageLoss = 0.0
var float profitFactor = 0.0
winRate := tradesCount > 0 ? (winningTradesCount / tradesCount) * 100 : 0
averageProfit := winningTradesCount > 0 ? totalProfit / winningTradesCount : 0
averageLoss := losingTradesCount > 0 ? totalProfit / losingTradesCount : 0
profitFactor := averageLoss != 0 ? math.abs(averageProfit / averageLoss) : 0