
Overview
This is an innovative quantitative trading strategy that provides a structured approach to trading by integrating liquidity zone entries, ATR volatility thresholds, and dynamic risk management. The strategy combines multiple technical analysis indicators to identify high-probability trading opportunities and automatically calculate take profit and stop loss levels.
Strategy Principles
The core principles of the strategy are based on the following key elements:
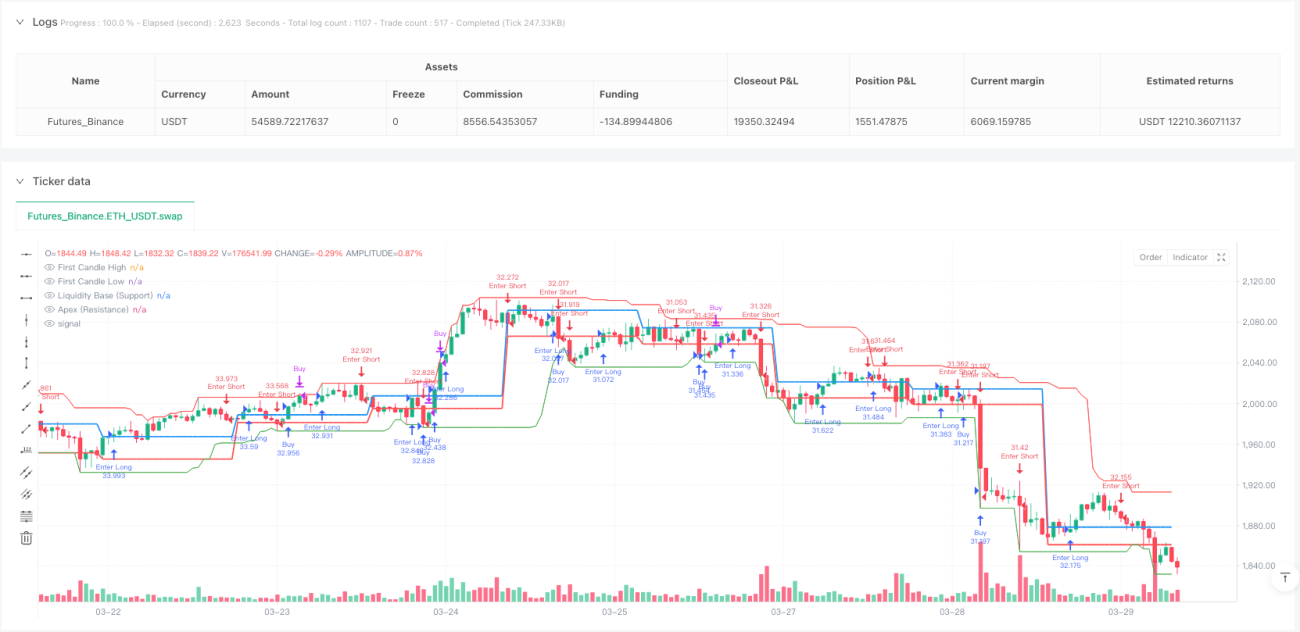
- Liquidity Zone Analysis: Identifying potential support and resistance areas by calculating the lowest and highest points over a specific period.
- ATR Volatility Filtering: Using Average True Range (ATR) as a dynamic threshold for entry and risk management.
- Trend Filtering: Combining 50-period Exponential Moving Average (EMA) and Relative Strength Index (RSI) to confirm market trend and momentum.
- Dynamic Risk Management: Automatically calculating take profit and stop loss levels based on ATR, with flexible risk/reward ratio adjustment.
Strategy Advantages
- Multi-Dimensional Signal Generation: Combining liquidity, volatility, and trend filtering to improve signal quality.
- Adaptive Risk Management: Dynamically adjusting take profit and stop loss to effectively control trading risk.
- Flexible Parameter Configuration: Customizable ATR length, liquidity period, and trading session.
- Visualization Support: Providing visualization of liquidity lines and first candle level.
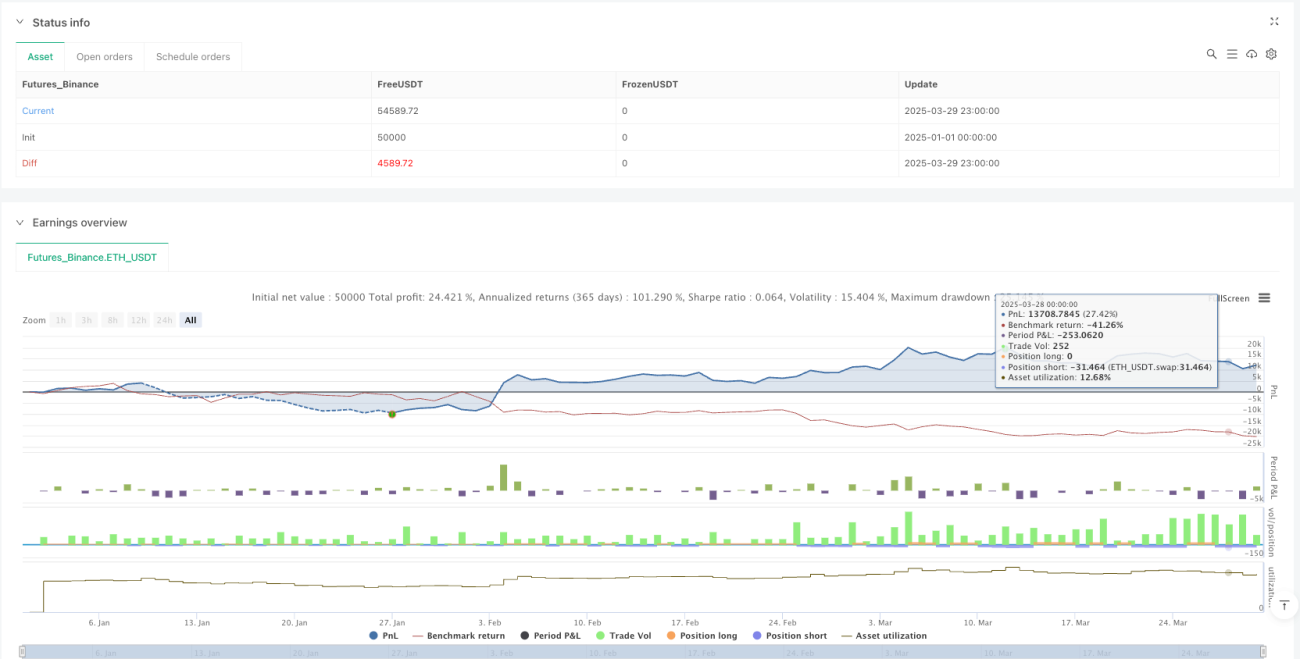
- Performance Tracking: Built-in trading statistics table displaying win rate and trade outcomes directly on the chart.
Strategy Risks
- Parameter Sensitivity: Strategy performance highly depends on parameter selection, requiring continuous backtesting and optimization.
- Market Adaptability: Potential instability in markets with unclear trends or high volatility.
- False Breakout Risk: Potential for misreported liquidity zone breakouts.
- Trading Frequency: Session filtering and multiple conditions may reduce trading opportunities.
- Backtest Bias: The 64% historical win rate may not fully represent future performance.
Strategy Optimization Directions
- Machine Learning Integration: Introducing machine learning algorithms for dynamic parameter and signal generation adjustment.
- Multi-Market Adaptability: Developing more universal parameter settings applicable to different markets and instruments.
- Advanced Risk Management: Implementing more complex position sizing and risk allocation algorithms.
- Signal Confirmation Mechanism: Adding additional confirmation indicators like volume or other technical indicators.
- Real-Time Performance Monitoring: Developing real-time performance assessment and adaptive adjustment modules.
Summary
The ThinkTech AI Trading Strategy provides traders with a powerful quantitative trading tool through an innovative multi-factor approach. By leveraging liquidity analysis, volatility filtering, and dynamic risk management, the strategy aims to identify high-quality trading opportunities. However, traders must continuously backtest, optimize, and apply the strategy cautiously to fully realize its potential.
/*backtest
start: 2025-01-01 00:00:00
end: 2025-03-30 00:00:00
period: 1h
basePeriod: 1h
exchanges: [{"eid":"Futures_Binance","currency":"ETH_USDT"}]
*/

if high > ta.highest(high[1], 5)
    strategy.entry("Enter Long", strategy.long)
else if low < ta.lowest(low[1], 5)
strategy.entry("Enter Short", strategy.short)//@version=6- 1