
Overview
This is an Average True Range (ATR)-based trend-following strategy designed to capture high-probability trades by combining multiple technical indicators. The strategy integrates ATR filtering, Supertrend indicator, Exponential Moving Average (EMA) and Simple Moving Average (SMMA) trend bands, Relative Strength Index (RSI) confirmation, and a dynamic stop-loss system, aiming to provide a comprehensive and flexible trading approach.
Strategy Principles
The core principle is based on the synergistic action of multiple technical indicators:
-
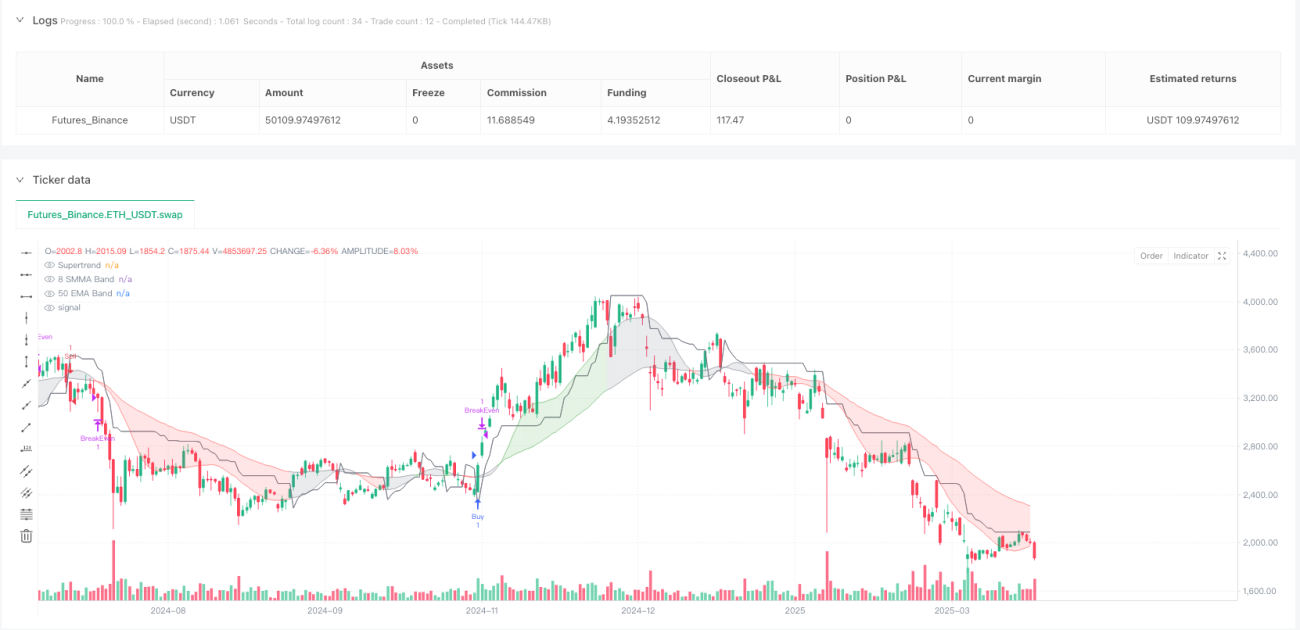
Trend Identification: Using Supertrend indicator (parameters: factor 2, length 5) and 50-day EMA with 8-day SMMA trend bands to define market trend direction. Trends are color-coded:
- Green: Bullish trend
- Red: Bearish trend
- Gray: Neutral phase
-
ATR Smart Filtering: Detecting volatility expansion through 14-period ATR and 50-period Simple Moving Average, trading only when ATR is rising or above 101% of its SMA, ensuring entries only in strong trends.
-
Entry Conditions:
- Long Entry: Price above 50-day EMA, Supertrend bullish, RSI > 45, ATR confirms trend strength
- Short Entry: Price below 50-day EMA, Supertrend bearish, RSI < 45, ATR confirms trend strength
-
Dynamic Stop-Loss and Take-Profit:
- Take-Profit: Adaptive based on 5x ATR
- Stop-Loss: Trailing stop-loss at 3.5x ATR
- Break-Even Stop: Activated after price moves 2x ATR
- Fixed Stop-Loss: Risk management using 0.8x ATR multiplier
Strategy Advantages
- Effectively filter volatile markets, avoiding trading in low volatility zones
- Prevent over-trading through take-profit lock mechanism
- Capture strong trends, allowing profits to run with trailing stop-loss
- Reduce drawdowns with ATR-based stop-loss
- Adjustable parameters for fine-tuning across different markets
Strategy Risks
- Over-reliance on technical indicators may lead to false signals
- Potential poor performance in ranging markets
- Improper parameter settings may increase trading costs
- RSI confirmation might miss rapid trend changes
Strategy Optimization Directions
- Integrate machine learning algorithms for dynamic parameter adjustment
- Add additional filters like volume confirmation
- Explore optimal parameter combinations across different markets and timeframes
- Develop multi-timeframe verification mechanisms
Conclusion
This is an advanced trend-following strategy that provides traders with a flexible and powerful trading tool through multi-indicator synergy and dynamic risk management. Continuous backtesting and optimization are key to successful application.
- 1