
Overview
This strategy is an innovative multi-timeframe trading approach that combines Smart Money Concepts (SMC), Exponential Moving Average (EMA), and multi-timeframe trend analysis, aimed at capturing trading opportunities through precise support and resistance zone identification and dynamic market signals.
Strategy Principles
The strategy core is based on the following key technical indicators and analysis methods:
- Multi-Timeframe Trend Confirmation: Simultaneously utilizing Simple Moving Averages (SMA) on 5-minute and 15-minute timeframes for trend determination.
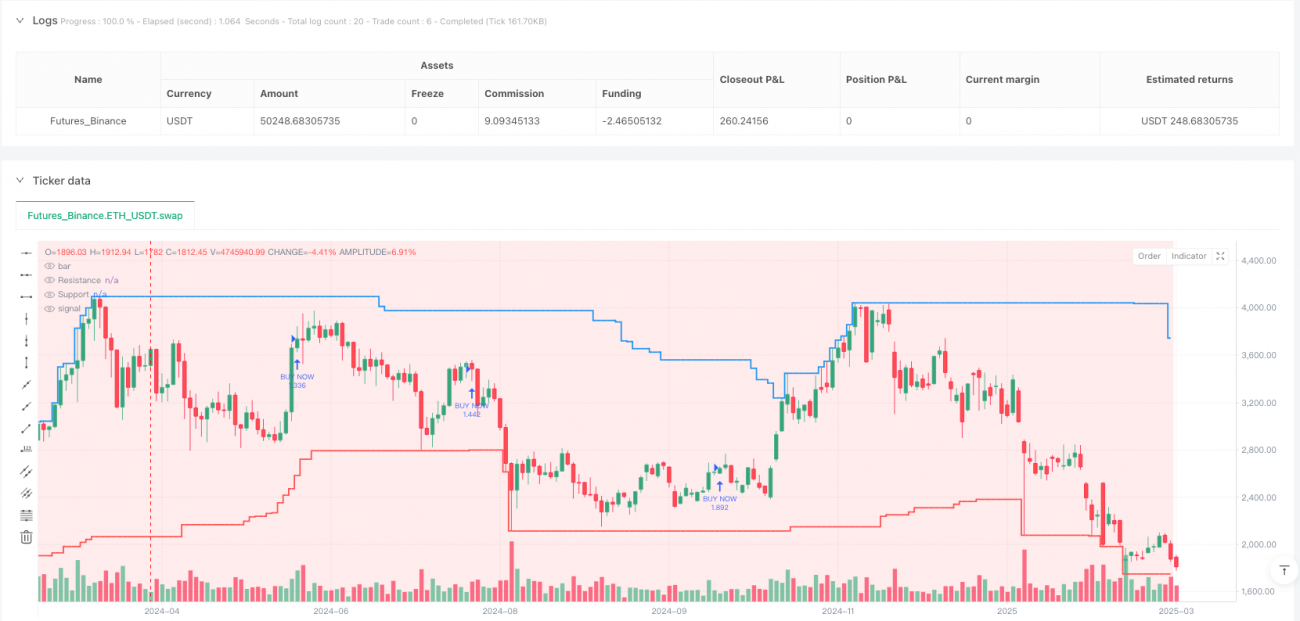
- Support and Resistance Zone Identification: Calculating dynamic support and resistance lines through 50-period highest and lowest prices.
- Supply and Demand Area Analysis: Evaluating 20-period lowest and highest prices as key supply and demand zones.
- Smart Money Concepts (SMC) Liquidity Grab: Identifying market liquidity traps and breakthrough points.
- Trading Signal Generation: Combining fast and slow EMA crossovers, trend direction, support and resistance zones, and volatility filtering.
Strategy Advantages
- Multi-Dimensional Market Analysis: Comprehensive consideration of multi-timeframe trends, improving signal accuracy.
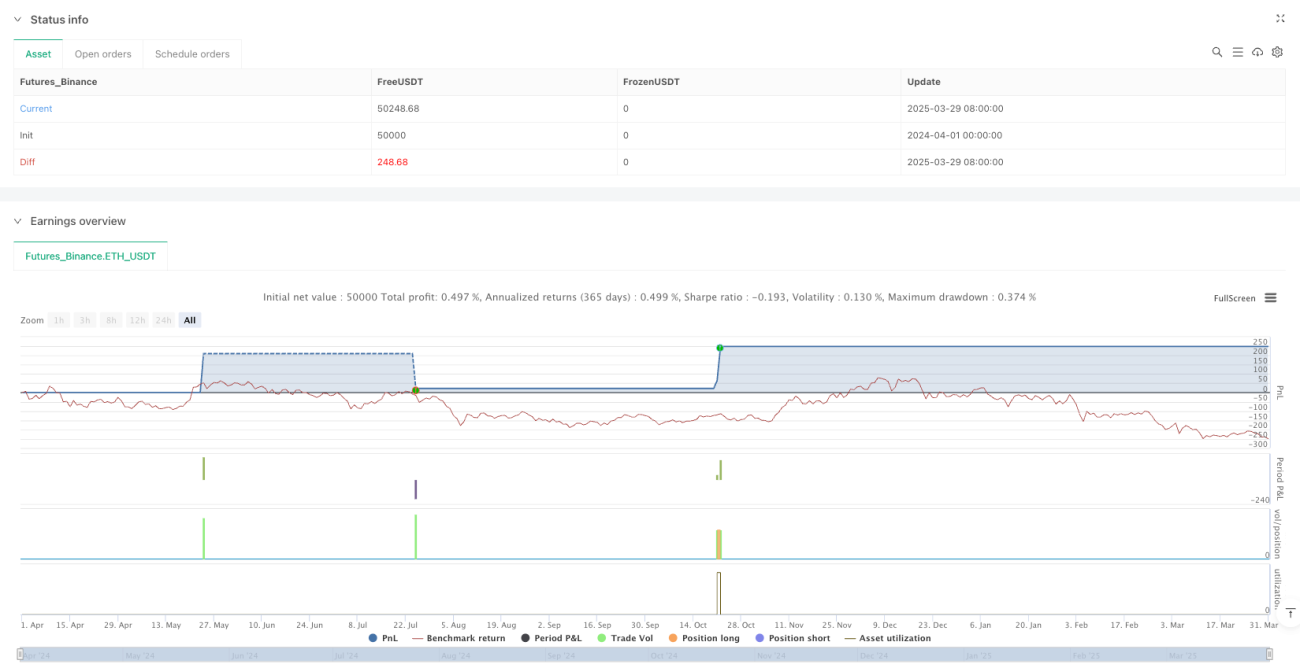
- Dynamic Risk Management: Fixed take-profit and stop-loss points (100 pips), effectively controlling single trade risk.
- Smart Money Concepts Application: Identifying more precise entry timing through liquidity grab and breakthrough area recognition.
- Volatility Filtering: Avoiding trading in high volatility markets, reducing irrational trading risks.
- Flexible Trading Signal Generation: Comprehensive consideration of trends, momentum, and market structure.
Strategy Risks
- Limitations of Fixed Take-Profit and Stop-Loss: May not adapt to optimal risk management under different market conditions.
- Multiple Condition Constraints: Complex signal generation conditions may reduce trading opportunities.
- Timeframe Limitations: Using only 5-minute and 15-minute timeframes may miss larger trends.
- Technical Indicator Lagging: EMA and SMA as lagging indicators may delay signals.
Strategy Optimization Directions
- Dynamic Take-Profit and Stop-Loss: Introducing adaptive TP/SL mechanisms based on volatility or support/resistance zones.
- Timeframe Expansion: Incorporating more timeframes (such as 1-hour, 4-hour) for trend confirmation.
- Machine Learning Optimization: Using machine learning algorithms to dynamically adjust entry and exit parameters.
- Volatility Adjustment: Developing more refined volatility filtering algorithms.
- Risk Scoring System: Introducing a comprehensive risk scoring system to dynamically adjust position sizes.
Summary
This strategy provides traders with a systematic and standardized trading method by integrating multi-timeframe analysis, Smart Money Concepts, and advanced signal generation mechanisms. Despite potential risks, its multi-dimensional analysis and dynamic risk management offer significant advantages for traders. Future optimizations will further enhance the strategy's adaptability and profit potential.
- 1