
概述
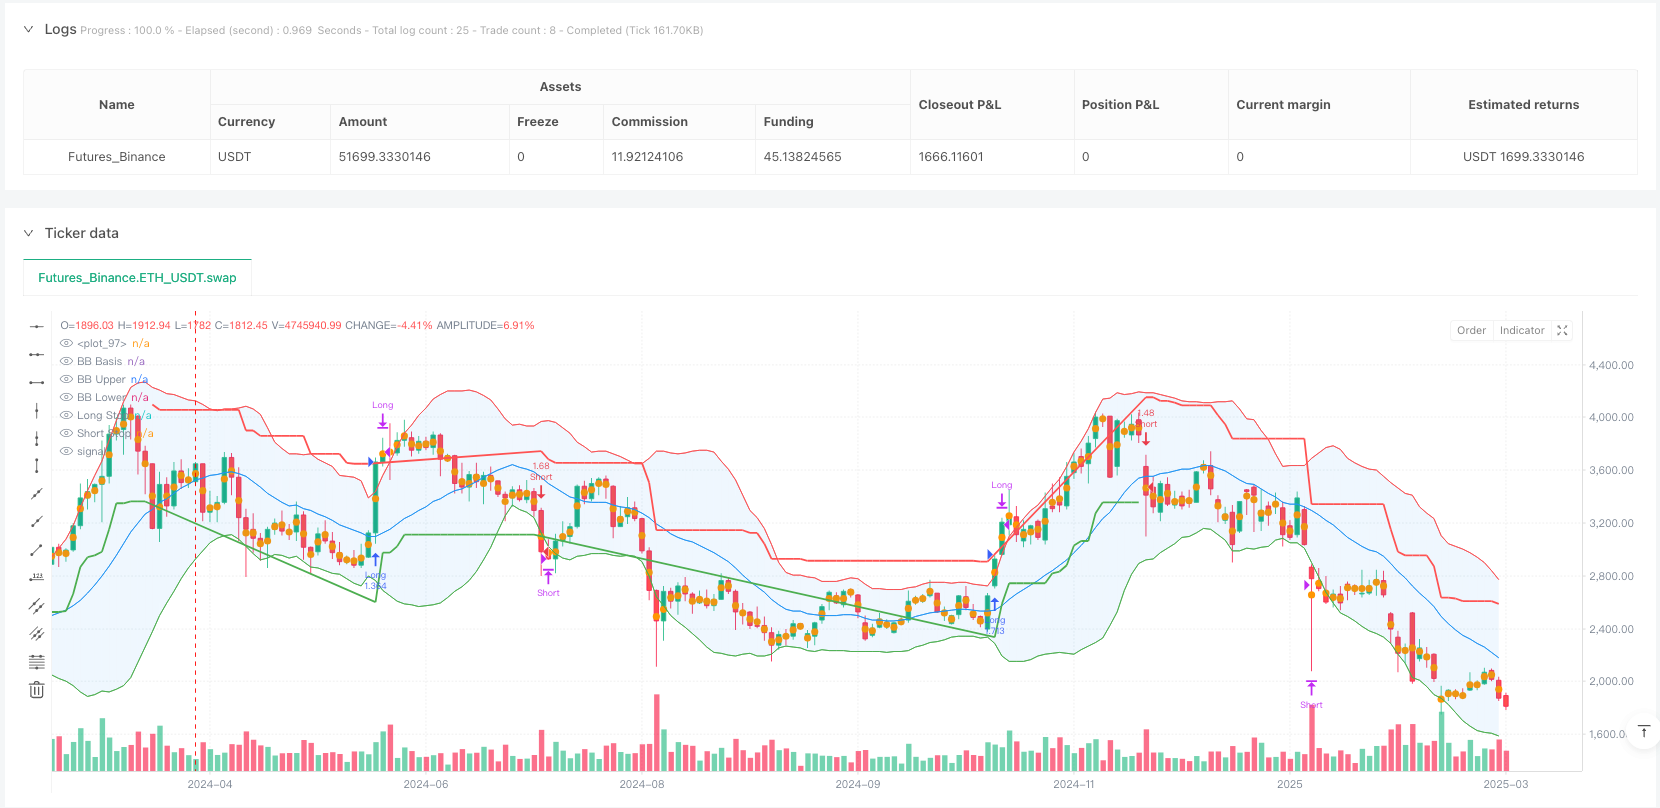
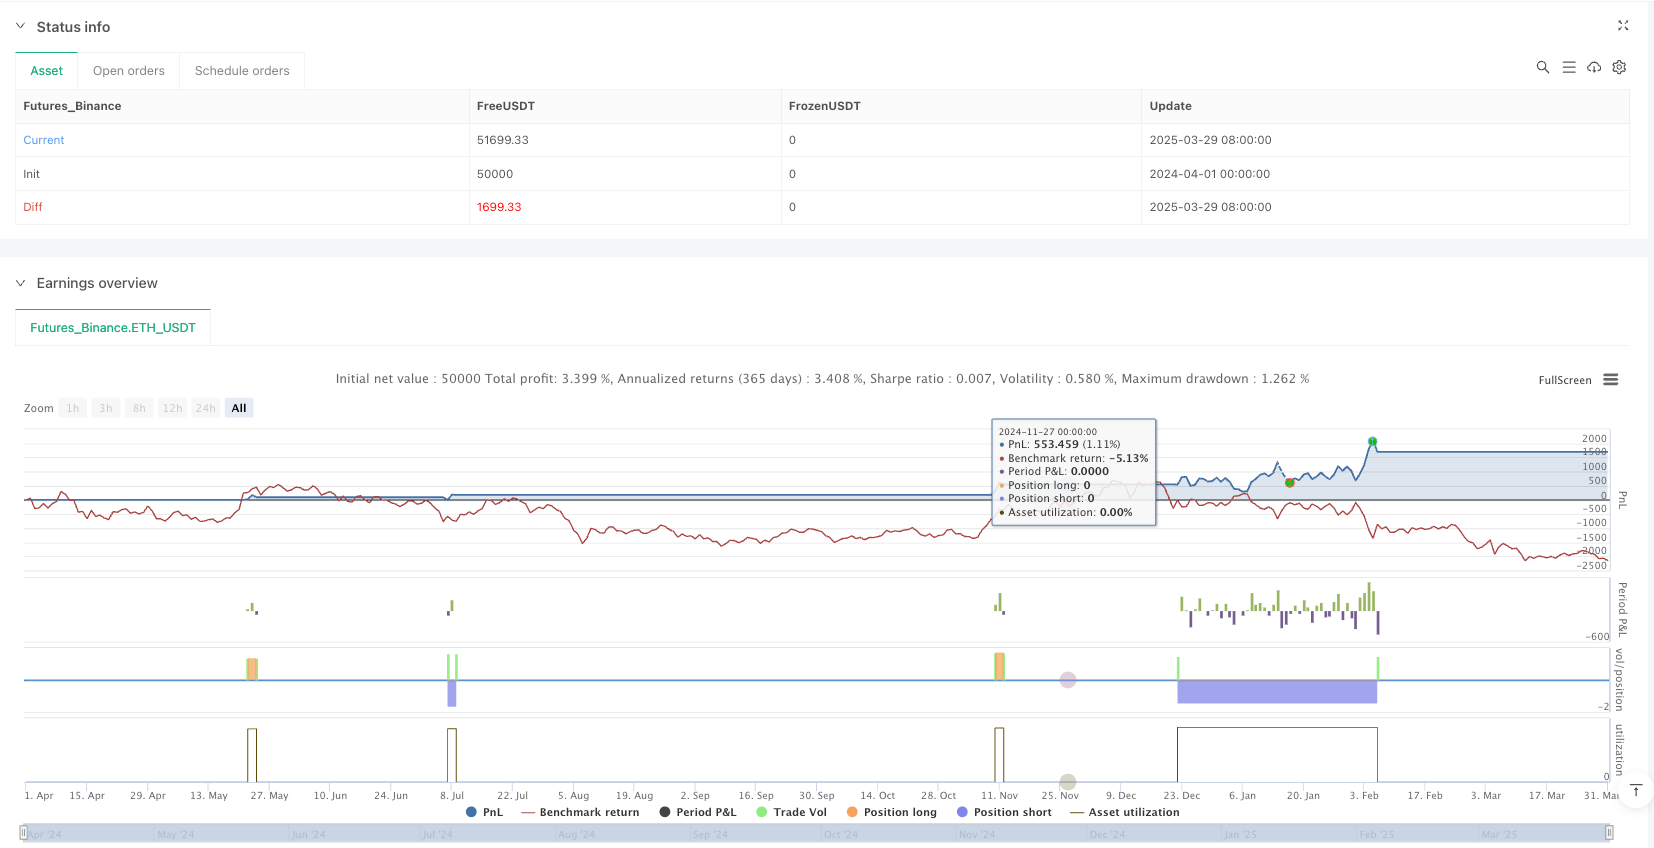
本文介绍了一种结合布林带(Bollinger Bands)和超级趋势(SuperTrend)指标的复合交易策略。该策略通过整合多个技术分析工具,旨在提供更精准的市场入场和出场信号,同时降低交易风险。
策略原理
该策略核心由两个主要部分组成:布林带(Bollinger Bands)和超级趋势(SuperTrend)指标。
- 布林带计算部分:
- 使用可配置的移动平均线(MA)计算基准线
- 根据标准差倍数生成上下轨道
- 支持多种移动平均线类型:简单移动平均线(SMA)、指数移动平均线(EMA)、平滑移动平均线(SMMA)、加权移动平均线(WMA)和成交量加权移动平均线(VWMA)
- 超级趋势(SuperTrend)部分:
- 利用平均真实波动范围(ATR)计算止损位
- 动态判断市场趋势方向
- 根据趋势变化生成买卖信号
策略优势
- 多指标组合:通过结合布林带和超级趋势,提高信号准确性
- 灵活配置:可自定义移动平均线类型、参数和计算方法
- 动态止损:基于ATR的止损机制可有效控制风险
- 可视化增强:提供趋势状态填充和信号标签
- 风险管理:设置了百分比仓位管理和金字塔交易限制
策略风险
- 参数敏感性:不同市场环境下,参数可能需要频繁调整
- 回测局限性:历史数据表现不代表未来市场表现
- 多空切换风险:频繁变换仓位可能增加交易成本
- 指标滞后性:技术指标存在一定的信号延迟
策略优化方向
- 引入机器学习算法动态优化参数
- 增加额外过滤条件,如成交量确认
- 开发多时间框架验证机制
- 优化风险管理模块,引入更精细的仓位控制策略
总结
这是一种结合多重动态指标的交易策略,通过布林带和超级趋势的组合,提供了一个相对全面的交易信号系统。策略的核心在于平衡信号准确性和风险管理,但仍需根据不同市场环境持续优化和调整。
策略源码
/*backtest
start: 2024-04-01 00:00:00
end: 2025-03-31 00:00:00
period: 2d
basePeriod: 2d
exchanges: [{"eid":"Futures_Binance","currency":"ETH_USDT"}]
*/

//@version=6
strategy("Combined BB & New SuperTrend Strategy", overlay=true, initial_capital=100000, default_qty_type=strategy.percent_of_equity, default_qty_value=10, pyramiding=0)

//============================
// Bollinger Bands Parameters
//============================
lengthBB   = input.int(20, minval=1, title="BB Length")
maType     = input.string("SMA", "BB Basis MA Type", options=["SMA", "EMA", "SMMA (RMA)", "WMA", "VWMA"])
srcBB      = input(close, title="BB Source")
multBB     = input.float(2.0, minval=0.001, maxval=50, title="BB StdDev Multiplier")
offsetBB   = input.int(0, title="BB Offset", minval=-500, maxval=500)

// Moving average function based on chosen type
ma(source, length, _type) =>
    switch _type
        "SMA"         => ta.sma(source, length)
        "EMA"         => ta.ema(source, length)
        "SMMA (RMA)"  => ta.rma(source, length)
        "WMA"         => ta.wma(source, length)
        "VWMA"        => ta.vwma(source, length)

// Bollinger Bands calculations
basis   = ma(srcBB, lengthBB, maType)
dev     = multBB * ta.stdev(srcBB, lengthBB)
upperBB = basis + dev
lowerBB = basis - dev

// Plot Bollinger Bands
plot(basis, title="BB Basis", color=color.blue, offset=offsetBB)
p1 = plot(upperBB, title="BB Upper", color=color.red, offset=offsetBB)
p2 = plot(lowerBB, title="BB Lower", color=color.green, offset=offsetBB)
fill(p1, p2, title="BB Fill", color=color.new(color.blue, 90))

//============================
// New SuperTrend Parameters & Calculations
// (Based on the new script you provided)
//============================
st_length         = input.int(title="ATR Period", defval=22)
st_mult           = input.float(title="ATR Multiplier", step=0.1, defval=3)
st_src            = input.source(title="SuperTrend Source", defval=hl2)
st_wicks          = input.bool(title="Take Wicks into Account?", defval=true)
st_showLabels     = input.bool(title="Show Buy/Sell Labels?", defval=true)
st_highlightState = input.bool(title="Highlight State?", defval=true)

// Calculate ATR component for SuperTrend
st_atr = st_mult * ta.atr(st_length)

// Price selection based on wicks option
st_highPrice = st_wicks ? high : close
st_lowPrice  = st_wicks ? low  : close
st_doji4price = (open == close and open == low and open == high)

// Calculate SuperTrend stop levels
st_longStop = st_src - st_atr
st_longStopPrev = nz(st_longStop[1], st_longStop)
if st_longStop > 0
    if st_doji4price
        st_longStop := st_longStopPrev
    else
        st_longStop := (st_lowPrice[1] > st_longStopPrev ? math.max(st_longStop, st_longStopPrev) : st_longStop)
else
    st_longStop := st_longStopPrev

st_shortStop = st_src + st_atr
st_shortStopPrev = nz(st_shortStop[1], st_shortStop)
if st_shortStop > 0
    if st_doji4price
        st_shortStop := st_shortStopPrev
    else
        st_shortStop := (st_highPrice[1] < st_shortStopPrev ? math.min(st_shortStop, st_shortStopPrev) : st_shortStop)
else
    st_shortStop := st_shortStopPrev

// Determine trend direction: 1 for bullish, -1 for bearish
var int st_dir = 1
st_dir := st_dir == -1 and st_highPrice > st_shortStopPrev ? 1 : st_dir == 1 and st_lowPrice < st_longStopPrev ? -1 : st_dir

// Define colors for SuperTrend
st_longColor  = color.green
st_shortColor = color.red

// Plot SuperTrend stops
st_longStopPlot  = plot(st_dir == 1 ? st_longStop : na, title="Long Stop", style=plot.style_line, linewidth=2, color=st_longColor)
st_shortStopPlot = plot(st_dir == -1 ? st_shortStop : na, title="Short Stop", style=plot.style_line, linewidth=2, color=st_shortColor)

// Generate SuperTrend signals based on direction change
st_buySignal  = st_dir == 1 and st_dir[1] == -1
st_sellSignal = st_dir == -1 and st_dir[1] == 1

// Optionally plot labels for buy/sell signals
if st_buySignal and st_showLabels
    label.new(bar_index, st_longStop, "Buy", style=label.style_label_up, color=st_longColor, textcolor=color.white, size=size.tiny)
if st_sellSignal and st_showLabels
    label.new(bar_index, st_shortStop, "Sell", style=label.style_label_down, color=st_shortColor, textcolor=color.white, size=size.tiny)

// Fill the state area (optional visual enhancement)
st_midPricePlot = plot(ohlc4, title="", style=plot.style_circles, linewidth=1, display=display.none)
st_longFillColor  = st_highlightState ? (st_dir == 1 ? st_longColor : na) : na
st_shortFillColor = st_highlightState ? (st_dir == -1 ? st_shortColor : na) : na
fill(st_midPricePlot, st_longStopPlot, title="Long State Filling", color=st_longFillColor)
fill(st_midPricePlot, st_shortStopPlot, title="Short State Filling", color=st_shortFillColor)

//============================
// Trading Logic
//============================

// When a bullish reversal occurs, close any short position before entering long.
if st_buySignal
    strategy.close("Short")
    strategy.entry("Long", strategy.long)

// When a bearish reversal occurs, close any long position before entering short.
if st_sellSignal
    strategy.close("Long")
    strategy.entry("Short", strategy.short)

// Exit conditions using Bollinger Bands:
// - For a long position: exit if price reaches (or exceeds) the upper Bollinger Band.
// - For a short position: exit if price reaches (or falls below) the lower Bollinger Band.
if strategy.position_size > 0 and close >= upperBB
    strategy.close("Long", comment="Exit Long via BB Upper")
if strategy.position_size < 0 and close <= lowerBB
    strategy.close("Short", comment="Exit Short via BB Lower")
相关推荐