Multi-Technical Indicator Dynamic Stop-Loss Futures Trading Strategy

Strategy Overview
This strategy is an advanced futures trading system that combines multiple technical conditions and higher timeframe analysis to identify high-probability trading opportunities. The strategy employs a confluence-based approach, requiring multiple technical conditions to align before entering a trade. It integrates several sophisticated technical concepts including Fair Value Gaps (FVG), Order Blocks, Liquidity Sweeps, and Break of Structure (BOS) signals, while utilizing multi-timeframe indicators to confirm trend direction.
Strategy Principles
The core of this strategy is the combination of multiple technical analysis methods to ensure trades are only entered when several indicators align. Specifically, the strategy includes the following key components:
- Fair Value Gaps (FVG) - Identified when there is a significant price gap between two candles, indicating potential unfilled space in the market.
- Order Blocks - These are key areas where price formed a reversal, typically shown as strong rejection candles that later become support or resistance zones.
- Liquidity Sweeps - Identifies instances where the market breaks previous highs or lows and then quickly reverses, typically indicating institutional collection of liquidity.
- Break of Structure (BOS) - Occurs when price breaks a previous structure, forming higher highs or lower lows.
- Higher Timeframe Trend Confirmation - Uses 15-minute and 60-minute timeframe EMAs (Exponential Moving Averages) to confirm the overall trend direction.
The strategy only generates entry signals when at least two basic conditions (one in debug mode) plus a Break of Structure signal are present, and these align with the higher timeframe trend.
For risk management, the strategy uses ATR (Average True Range) to set dynamic stop-loss positions, typically at 1.5 times the ATR value. This approach increases stop distance during high volatility and reduces it during low volatility, making the stops more intelligent.
For profit-taking, the strategy employs a partial profit approach, taking 50% of the position at a profit equal to the risk (1R), while moving the stop-loss for the remaining position to breakeven, creating a risk-free opportunity. Additionally, there's a time-based exit mechanism that automatically closes trades if they don't move favorably within a specified time (default 30 minutes).
Furthermore, the strategy includes account management features that automatically exit all positions when the account profit reaches a preset target ($3,000) or triggers a trailing stop (which begins tracking after the account exceeds $2,500 in profit).
Strategy Advantages
After deep analysis of the code, we can summarize the following clear advantages:
- Multiple Confirmation System - Requiring several technical conditions to be met simultaneously reduces false signals and improves trade quality.
- Intelligent Risk Management - Using ATR-based dynamic stops adapts better to market volatility changes than fixed point or percentage stops.
- Higher Timeframe Trend Filtering - Utilizing higher timeframe trend direction avoids counter-trend trading by only trading in the direction of the trend.
- Partial Profit Strategy - Through partial profit-taking and moving stops to breakeven, the strategy both secures partial profits and creates risk-free opportunities for remaining positions.
- Time-Based Exit Mechanism - Automatically exits ineffective trades, preventing capital from being tied up in trades without momentum.
- Overall Account Management - Protects overall account profits through profit targets and trailing stops, achieving robust capital management.
- High Adaptability - Offers high flexibility through multiple parameters that can be adjusted according to different market conditions and trading styles.
- Professional Technical Indicator Integration - Combines multiple advanced technical analysis concepts typically used only by professional traders.
Strategy Risks
Despite its sophisticated design, there are several potential risks, including:
- Parameter Optimization Risk - The strategy relies on multiple parameter settings, which if over-optimized could lead to overfitting and poor performance in future market conditions. The solution is to use sufficiently long testing periods and conduct forward testing.
- Market Environment Dependency - The strategy may perform excellently in trending markets but could generate more false signals in range-bound markets. The solution is to add market environment filters and adjust trading frequency or stop trading entirely when a ranging market is identified.
- Execution Slippage Risk - During high volatility periods, entry and exit prices may differ significantly from expectations, affecting strategy performance. The solution is to simulate realistic slippage in backtesting and use limit orders instead of market orders in actual trading.
- Technical Failure Risk - Automated trading systems may face technical failures or network interruptions. The solution is to establish backup systems and manual intervention mechanisms.
- Complexity Management - The strategy's complexity may make it difficult to diagnose problems or understand why certain trades failed. The solution is to maintain detailed trading logs and regularly analyze strategy performance.
- Market Liquidity Risk - Under specific market conditions, such as before and after important news releases, liquidity may rapidly decrease, leading to greater slippage or inability to exit positions. The solution is to avoid trading during major economic data releases or reduce position sizes during these periods.
Strategy Optimization Directions
Based on code analysis, here are several potential optimization directions:
- Enhanced Trend Identification - The current strategy uses simple EMA crossovers to determine trends; consider adding other trend indicators like ADX (Average Directional Index) to confirm trend strength, as strong trending markets typically provide better trading opportunities.
- Market State Adaptation - Add market state recognition mechanisms to automatically adjust strategy parameters in different market environments (trending, ranging, high volatility, low volatility). This would make the strategy more flexible and adaptive to different market conditions.
- Optimized Entry Timing - Consider adding momentum indicators like RSI or stochastic oscillators to ensure that when entering in the trend direction, we also avoid entering in oversold or overbought conditions, thereby reducing reversal risk.
- Improved Profit Strategy - The current fixed 1R profit target may be too conservative or too aggressive; consider dynamically adjusting profit targets based on volatility or support/resistance levels, setting farther targets during higher volatility.
- Refined Risk Management - Introduce dynamic position sizing adjustment mechanisms that automatically adjust risk exposure based on recent strategy performance and market volatility, increasing risk when the strategy performs well and reducing it when performance declines.
- Add Intraday Time Filters - Futures markets have different characteristics during different time periods; adding time filters can avoid periods with poor liquidity or directionless markets.
- Integrate Market Sentiment Indicators - Add market sentiment indicators like VIX to adjust strategy parameters or pause trading during extreme sentiment situations.
- Optimize Code Efficiency - Some loop operations in the current code may affect execution efficiency, especially on smaller timeframes. Optimizing these loops can improve strategy response speed.
Summary
This is a well-designed multi-indicator futures trading strategy that integrates various advanced technical analysis concepts and features comprehensive risk and capital management functions. It reduces false signals by requiring multiple conditions to align simultaneously and higher timeframe trend confirmation, while using ATR-based dynamic stops and partial profit strategies to optimize the risk-reward ratio.
The strategy's main advantages lie in its multi-layered confirmation system and intelligent risk management, allowing it to capture high-probability trading opportunities while maintaining relatively low risk. However, the complexity of the strategy also brings challenges in parameter optimization and market adaptability, requiring continuous monitoring and regular adjustments to maintain its effectiveness.
By implementing the suggested optimization measures, especially enhancing market state adaptability and improving risk management systems, the strategy has the potential to maintain stable performance across different market environments. Overall, this is an advanced strategy suitable for experienced traders, which can become a powerful tool in a trading system with appropriate monitoring and adjustment.
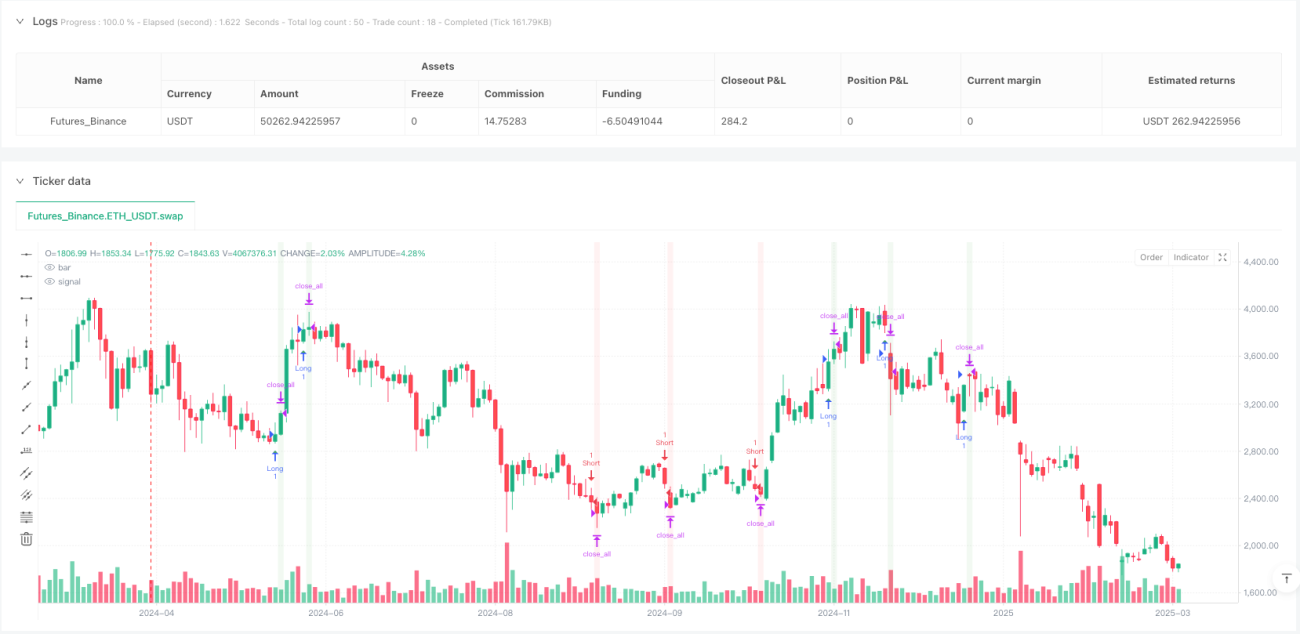
/*backtest
start: 2024-04-02 00:00:00
end: 2025-04-01 00:00:00
period: 2d
basePeriod: 2d
exchanges: [{"eid":"Futures_Binance","currency":"ETH_USDT"}]
*/

// @version=5
strategy("NQ Futures Trading Strategy", overlay=true, initial_capital=50000, default_qty_type=strategy.cash, default_qty_value=5000)

// ==========================================- 1