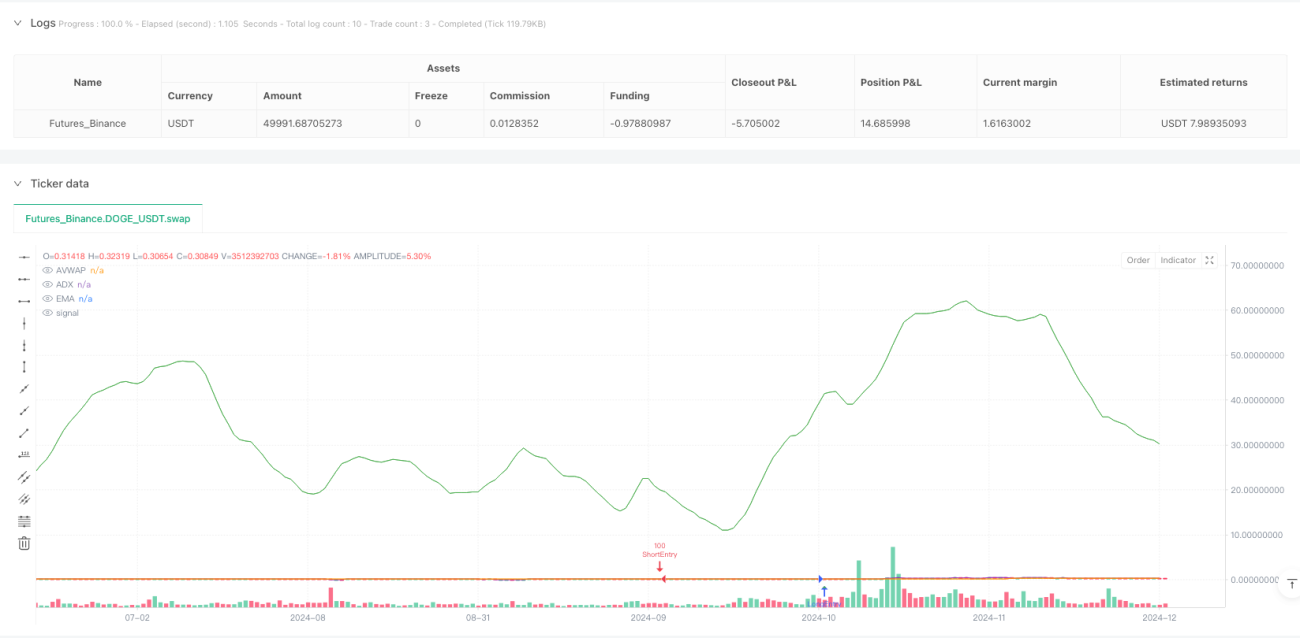
这是一种复杂的多指标交易策略,结合了成交量加权平均价格(AVWAP)、固定范围成交量分布(FRVP)、指数移动平均线(EMA)、相对强弱指数(RSI)、平均方向指数(ADX)和移动平均收敛散度(MACD)等多个技术分析工具,旨在通过指标聚合来识别高概率交易机会。
策略通过多重条件来确定入场信号: 1. 价格与AVWAP的交叉 2. 价格相对EMA的位置 3. RSI的强度判断 4. MACD趋势动量 5. ADX趋势强度确认 6. 成交量过滤器
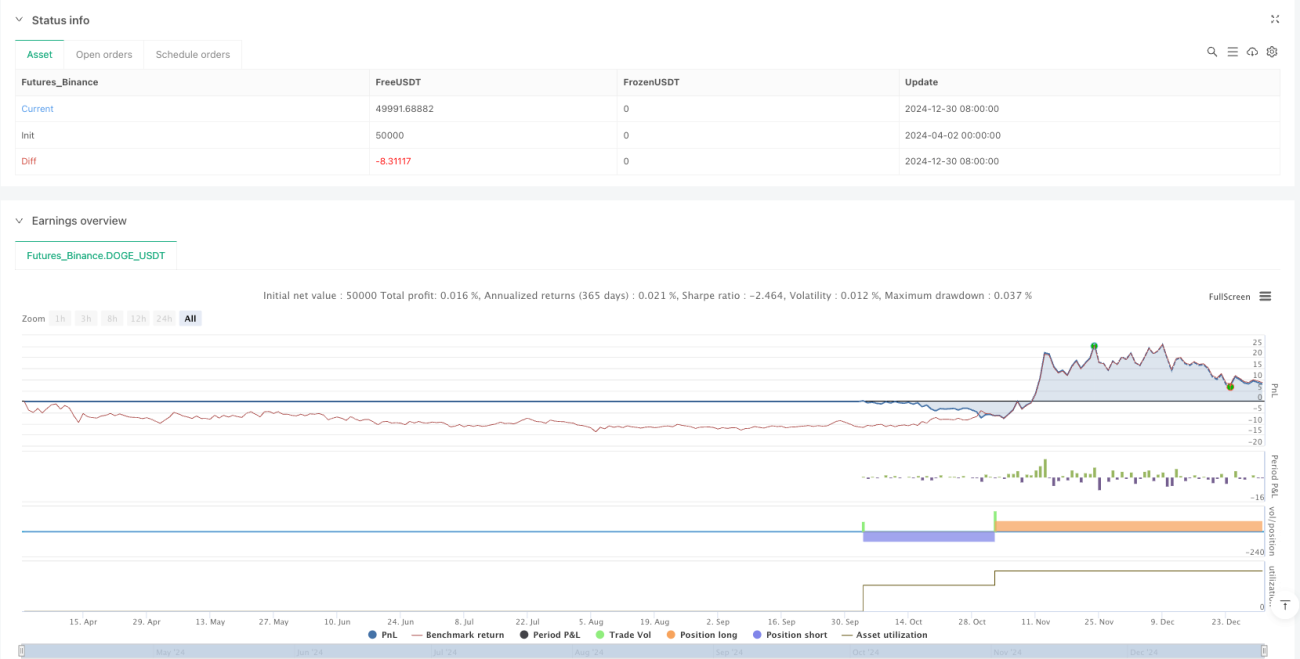
策略专注于亚洲、伦敦和纽约交易时段,这些时段通常流动性较好,交易信号更可靠。入场逻辑包括长仓和空仓两种模式,并设置了梯度止盈和止损机制。
这是一个高度定制且多维度的交易策略,通过整合多个技术指标和交易时段特征,试图提高交易信号的质量和准确性。策略展示了量化交易中指标聚合和动态风险管理的复杂性。
/*backtest
start: 2024-04-02 00:00:00
end: 2024-12-31 00:00:00
period: 1d
basePeriod: 1d
exchanges: [{"eid":"Futures_Binance","currency":"DOGE_USDT"}]
*/
//@version=6
strategy("FRVP + AVWAP by Grok", overlay=true, initial_capital=10000, default_qty_type=strategy.percent_of_equity, default_qty_value=100)
// User Inputs
frvpLength = input.int(20, title="FRVP Length", minval=1)
emaLength = input.int(75, title="EMA Length", minval=1) // Adjusted for stronger trend confirmation
rsiLength = input.int(14, title="RSI Length", minval=1)
adxThreshold = input.int(20, title="ADX Strength Threshold", minval=0, maxval=100)
volumeMultiplier = input.float(1.0, title="Volume Multiplier", minval=0.1)
// Stop Loss & Take Profit for XAUUSD
stopLossPips = 25 // 25 pips SL for Asian, London, NY Sessions
takeProfit1Pips = 35 // TP1 at 35 pips
takeProfit2Pips = 80 // Final TP at 80 pips
// Stop-Loss & Take-Profit Multipliers (XAUUSD: 1 pip = 0.1 points on most platforms)
stopMultiplier = float(stopLossPips) * 0.1
tp1Multiplier = float(takeProfit1Pips) * 0.1
tp2Multiplier = float(takeProfit2Pips) * 0.1
// Indicators
avwap = ta.vwap(close) // Volume Weighted Average Price (VWAP)
ema = ta.ema(close, emaLength) // Exponential Moving Average
rsi = ta.rsi(close, rsiLength) // Relative Strength Index
macdLine = ta.ema(close, 12) - ta.ema(close, 26) // MACD Line
signalLine = ta.ema(macdLine, 9) // MACD Signal Line
atr = ta.atr(14) // Average True Range
// Average Directional Index (ADX)
adxSmoothing = 14
[diplus, diminus, adx] = ta.dmi(14, adxSmoothing) // Corrected syntax for ta.dmi()
// Volume Profile (FRVP - Fixed Range Volume Profile Midpoint)
highestHigh = ta.highest(high, frvpLength)
lowestLow = ta.lowest(low, frvpLength)
frvpMid = (highestHigh + lowestLow) / 2 // Midpoint of the range
// Detect Trading Sessions
currentHour = hour(time, "UTC") // Renamed to avoid shadowing built-in 'hour'
isAsianSession = currentHour >= 0 and currentHour < 8
isLondonSession = currentHour >= 8 and currentHour < 16
isNYSession = currentHour >= 16 and currentHour < 23
// Entry Conditions
longCondition = ta.crossover(close, avwap) and close > ema and rsi > 30 and macdLine > signalLine and adx > adxThreshold
shortCondition = ta.crossunder(close, avwap) and close < ema and rsi < 70 and macdLine < signalLine and adx > adxThreshold
// Volume Filter
avgVolume = ta.sma(volume, 20) // 20-period Simple Moving Average of volume
volumeFilter = volume > avgVolume * volumeMultiplier // Trade only when volume exceeds its moving average
// Trade Execution with SL/TP for Sessions
if (longCondition and volumeFilter and (isAsianSession or isLondonSession or isNYSession))
strategy.entry("LongEntry", strategy.long, qty=100)
strategy.exit("LongTP1", from_entry="LongEntry", limit=close + tp1Multiplier)
strategy.exit("LongExit", from_entry="LongEntry", stop=close - stopMultiplier, limit=close + tp2Multiplier)
if (shortCondition and volumeFilter and (isAsianSession or isLondonSession or isNYSession))
strategy.entry("ShortEntry", strategy.short, qty=100)
strategy.exit("ShortTP1", from_entry="ShortEntry", limit=close - tp1Multiplier)
strategy.exit("ShortExit", from_entry="ShortEntry", stop=close + stopMultiplier, limit=close - tp2Multiplier)
// Plotting for Debugging and Visualization
plot(avwap, "AVWAP", color=color.purple, style=plot.style_line, offset=0)
plot(ema, "EMA", color=color.orange, style=plot.style_line, offset=0)
// plot(rsi, "RSI", color=color.yellow, style=plot.style_histogram, offset=0) // Better in a separate pane
// plot(macdLine, "MACD Line", color=color.blue, style=plot.style_histogram, offset=0) // Better in a separate pane
// plot(signalLine, "Signal Line", color=color.red, style=plot.style_histogram, offset=0) // Better in a separate pane
plot(adx, "ADX", color=color.green, style=plot.style_line, offset=0)
// Optional: Plot entry/exit signals for visualization
plotshape(longCondition and volumeFilter ? close : na, title="Long Signal", location=location.belowbar, color=color.green, style=shape.triangleup, size=size.tiny)
plotshape(shortCondition and volumeFilter ? close : na, title="Short Signal", location=location.abovebar, color=color.red, style=shape.triangledown, size=size.tiny)