
概述
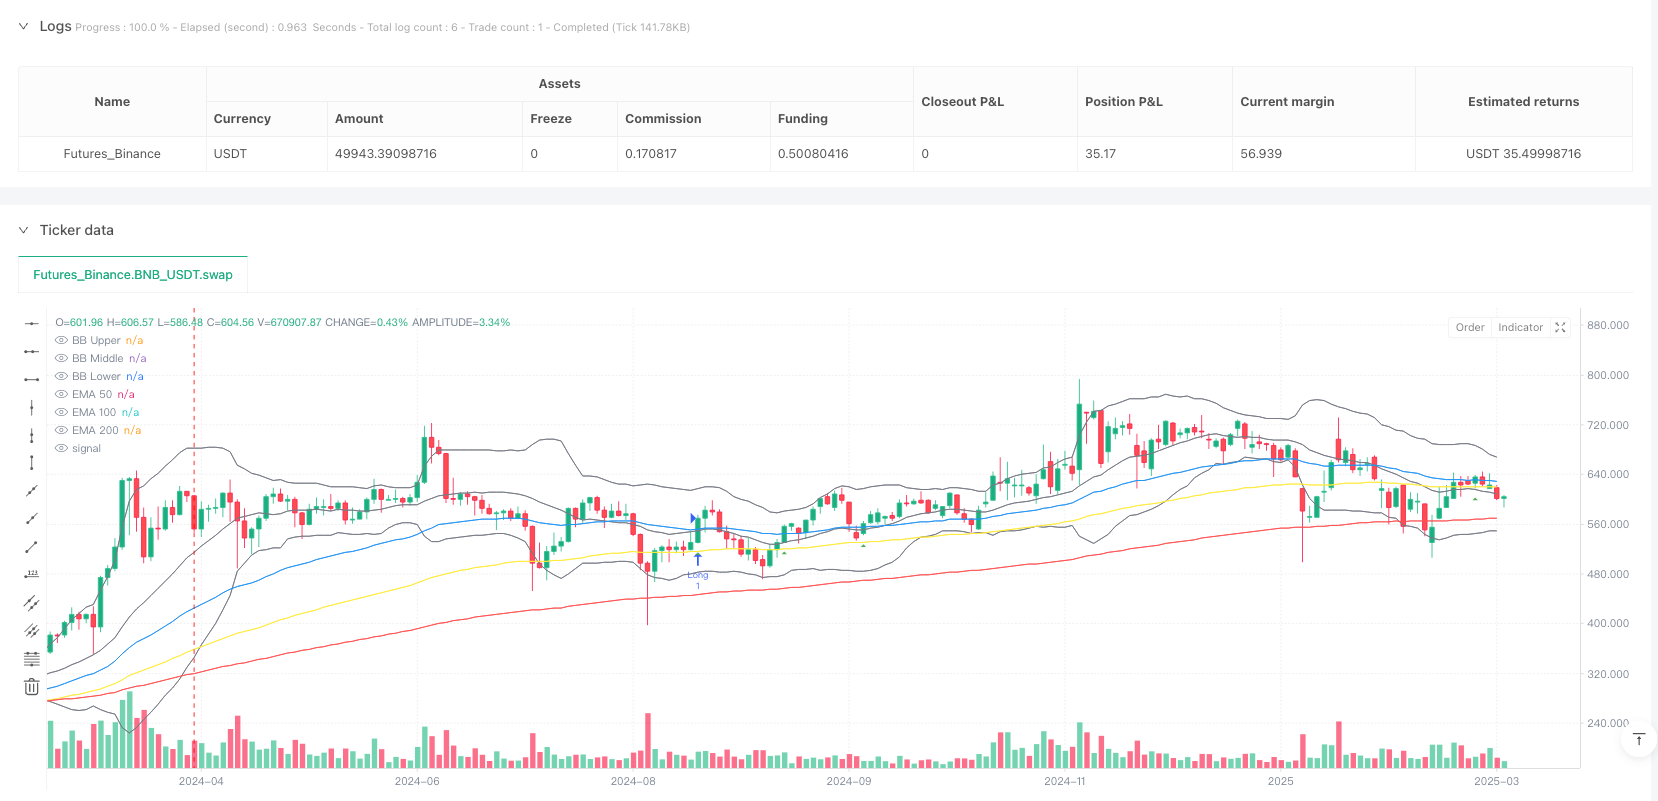
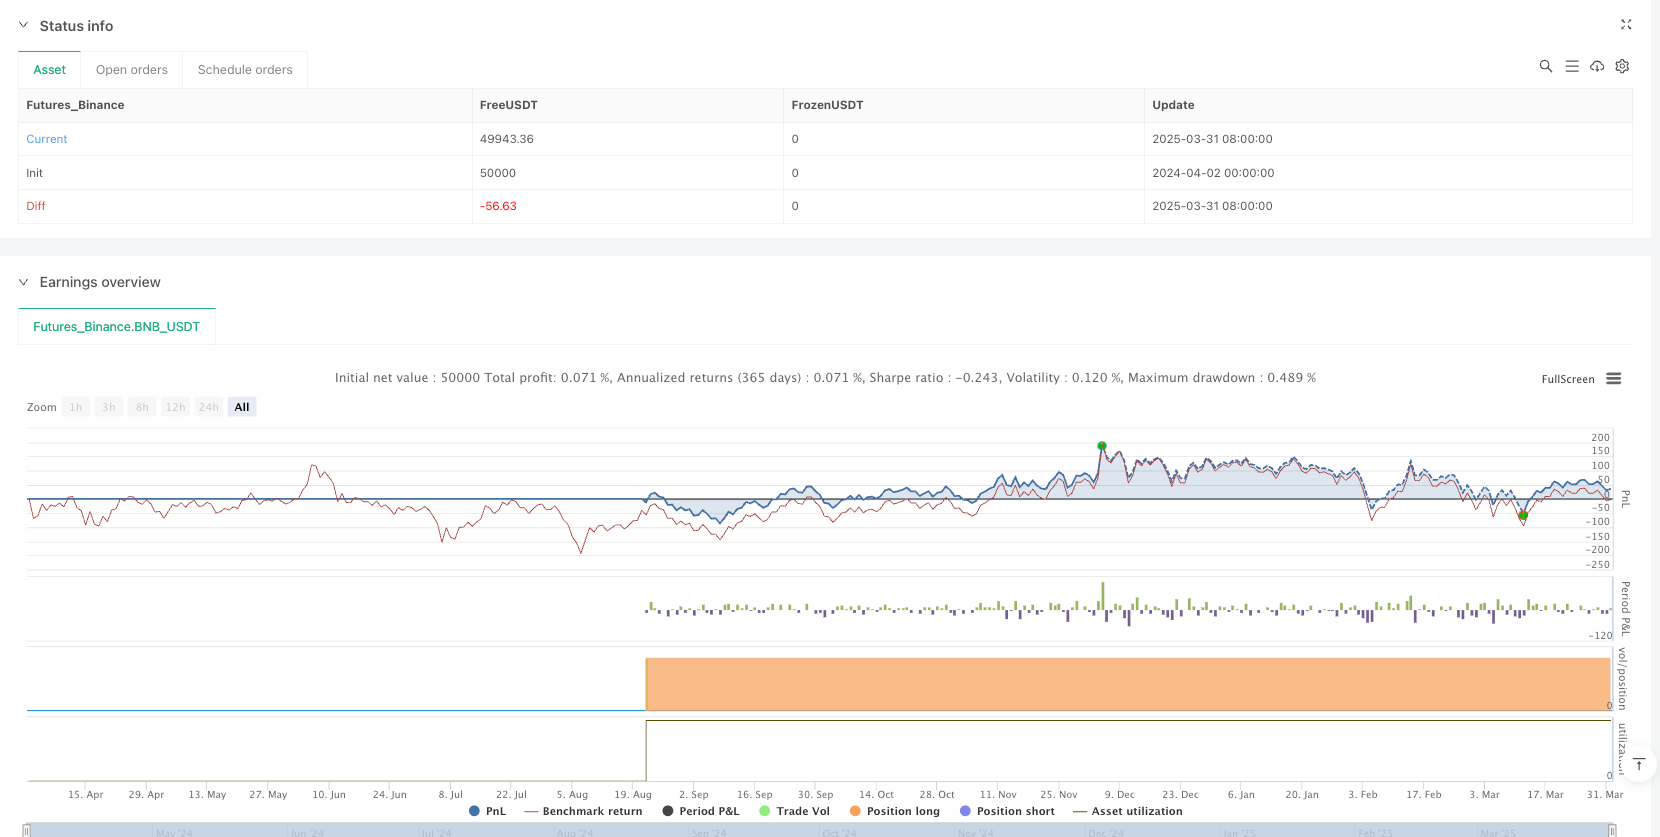
这是一种复杂的多指标交易策略,结合指数移动平均线(EMA)、相对强弱指数(RSI)、移动平均线收敛divergence(MACD)和布林带(Bollinger Bands)四种技术分析工具,旨在通过多重信号验证的方式识别潜在的交易入场点。该策略专注于捕捉趋势性价格运动,并通过严格的信号过滤机制降低错误信号的可能性。
策略原理
策略的核心原理基于四个关键技术指标的综合分析: 1. 使用三条不同周期的指数移动平均线(50、100、200)判断整体趋势方向 2. 利用RSI指标评估市场动量和超买超卖情况 3. 通过MACD线和信号线的交叉判断趋势动量 4. 结合布林带上下轨作为额外的价格波动参考
具体入场逻辑包括: - 做多条件: - 收盘价上穿50日EMA - 50日EMA高于100日EMA,且100日EMA高于200日EMA - RSI介于50-70之间 - MACD线高于信号线
- 做空条件:
- 收盘价下穿50日EMA
- 50日EMA低于100日EMA,且100日EMA低于200日EMA
- RSI介于30-50之间
- MACD线低于信号线
策略优势
- 多指标验证:通过四种不同指标的综合,显著提高信号的可靠性
- 趋势追踪能力强:使用三重EMA结构有效识别市场主导趋势
- 动量判断精准:RSI和MACD结合提供更精确的入场时机
- 风险控制:严格的入场条件降低了错误交易的概率
- 可视化清晰:策略提供清晰的视觉入场信号和趋势指示
策略风险
- 多重指标复杂性可能导致信号延迟
- 在震荡市场中可能产生较多无效信号
- 固定参数可能不适应所有市场环境
- 未设置止损机制存在潜在较大回撤风险
策略优化方向
- 引入自适应参数调整机制
- 增加止损和止盈策略
- 根据不同市场周期动态调整入场阈值
- 结合波动率指标进一步验证入场信号
- 评估并优化指标参数的最佳组合
总结
这是一种高度系统化的多参数交叉趋势动量策略,通过四种技术指标的复合验证,旨在提供更加精准和可靠的交易信号。尽管策略具有显著优势,但仍需要持续优化和风险管理。
策略源码
/*backtest
start: 2024-04-02 00:00:00
end: 2025-04-01 00:00:00
period: 2d
basePeriod: 2d
exchanges: [{"eid":"Futures_Binance","currency":"BNB_USDT"}]
*/

//@version=5
strategy("Multi-Indicator Trading Strategy", overlay=true)

// Input variables
len1 = input(50, "EMA 50")
len2 = input(100, "EMA 100")
len3 = input(200, "EMA 200")
rsiLength = input(14, "RSI Length")
rsiOverbought = input(70, "RSI Overbought")
rsiOversold = input(30, "RSI Oversold")

// Indicators
ema50 = ta.ema(close, len1)
ema100 = ta.ema(close, len2)
ema200 = ta.ema(close, len3)
rsi = ta.rsi(close, rsiLength)
[macdLine, signalLine, histLine] = ta.macd(close, 12, 26, 9)
[middle, upper, lower] = ta.bb(close, 20, 2)

// Trading signals
longCondition = ta.crossover(close, ema50) and ema50 > ema100 and ema100 > ema200 and rsi > 50 and rsi < rsiOverbought and macdLine > signalLine

shortCondition = ta.crossunder(close, ema50) and
                 ema50 < ema100 and
                 ema100 < ema200 and
                 rsi < 50 and
                 rsi > rsiOversold and
                 macdLine < signalLine

// Plots
plot(ema50, "EMA 50", color.blue)
plot(ema100, "EMA 100", color.yellow)
plot(ema200, "EMA 200", color.red)
plot(upper, "BB Upper", color.gray)
plot(middle, "BB Middle", color.gray)
plot(lower, "BB Lower", color.gray)

// Signals
plotshape(longCondition, "Long", shape.triangleup, location.belowbar, color.green)
plotshape(shortCondition, "Short", shape.triangledown, location.abovebar, color.red)

// Strategy
if (longCondition)
    strategy.entry("Long", strategy.long)

if (shortCondition)
    strategy.entry("Short", strategy.short)
相关推荐