
概述
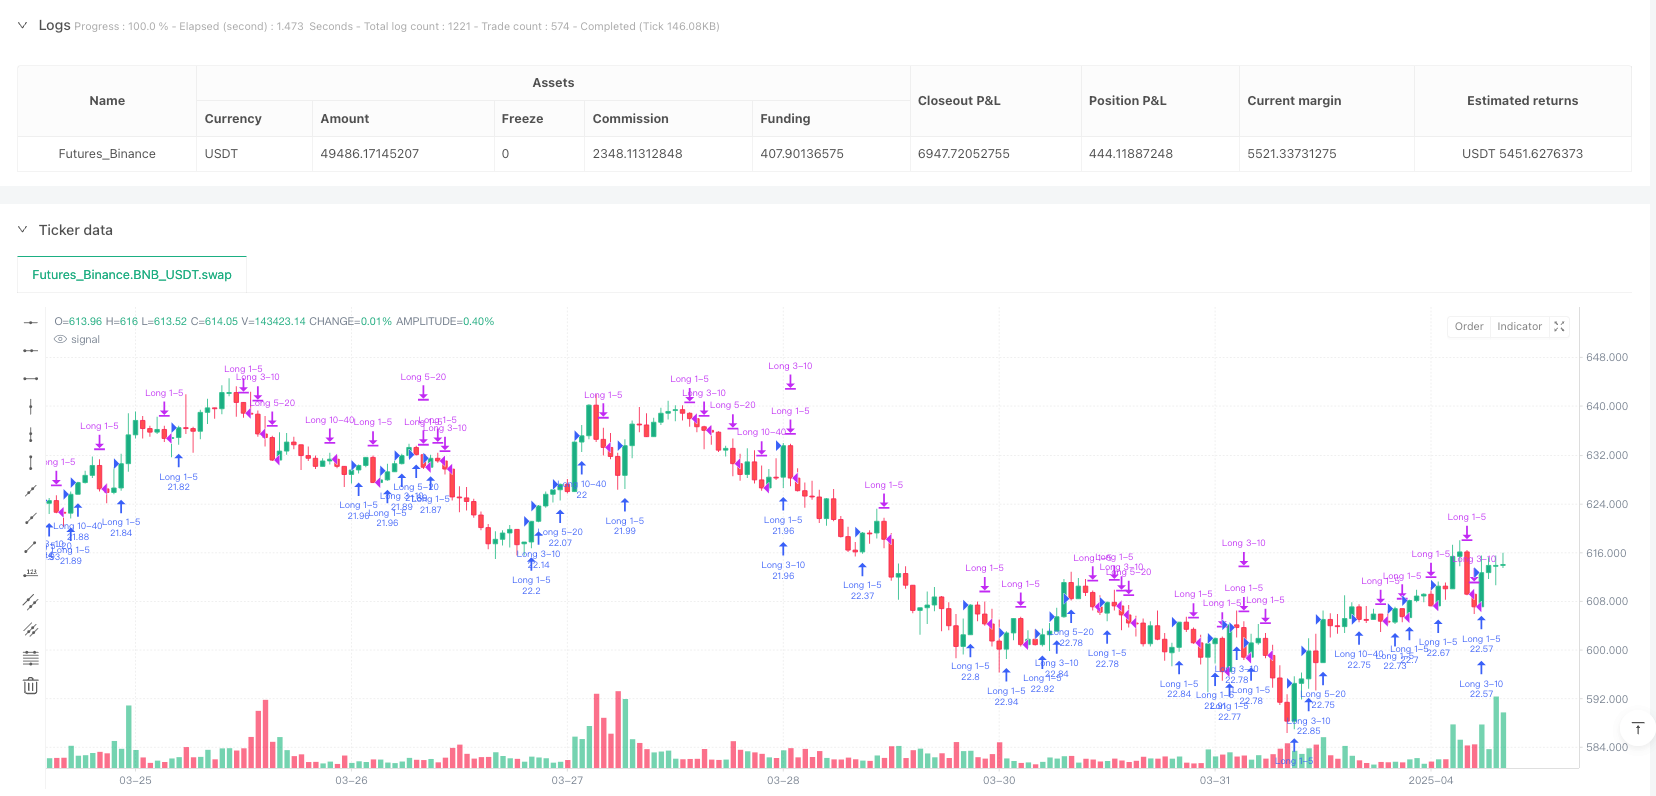
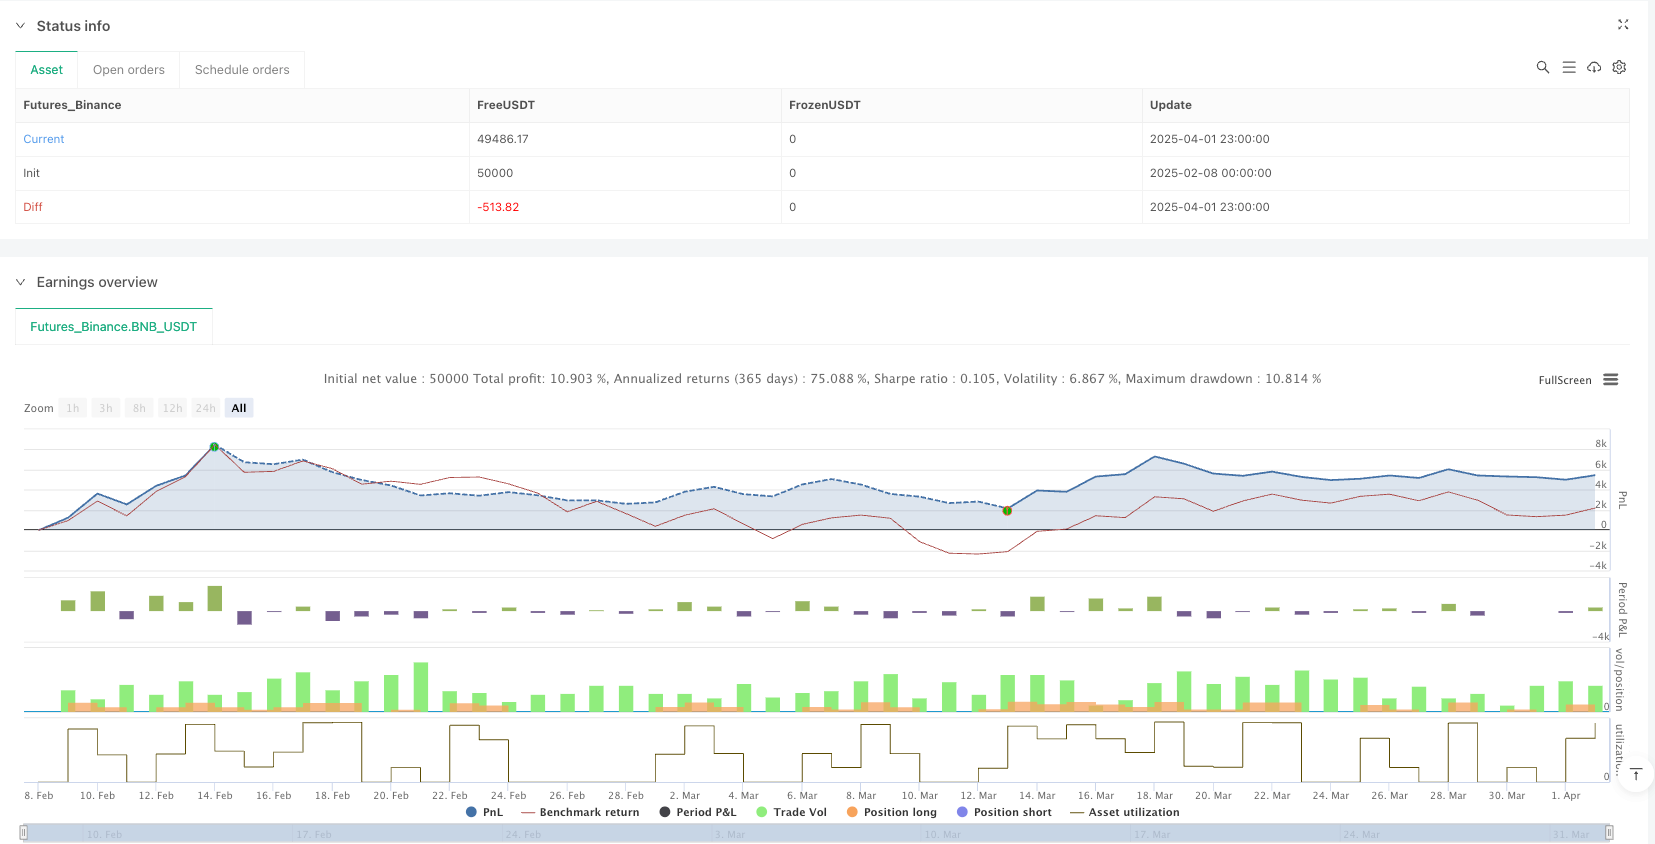
这是一种基于多重指数移动平均线(EMA)交叉的量化交易策略,通过捕捉不同时间周期EMA的交叉点来识别市场趋势,并生成交易信号。该策略旨在通过逐步确认的方式捕捉市场动量,并提供直观的可视化趋势判断机制。
策略原理
策略的核心逻辑基于四个不同周期EMA的交叉信号: 1. 第一入场信号:1日EMA上穿5日EMA,表示初步上涨动量 2. 第二入场信号:3日EMA上穿10日EMA,确认更强的上涨趋势 3. 第三入场信号:5日EMA上穿20日EMA,显示趋势进一步发展 4. 第四入场信号:10日EMA上穿40日EMA,表明长期牛市动能
策略通过颜色编码直观展示市场情绪:蓝色系表示看涨,红色系表示看跌。颜色深浅反映了短期EMA相对长期EMA的位置关系。
策略优势
- 渐进式确认:多重EMA交叉提供分层趋势确认机制
- 可视化反馈:柱状图颜色快速呈现市场情绪变化
- 灵活性强:适用于比特币等具有明显趋势性的市场
- 动态头寸管理:可逐步增加仓位,降低单次交易风险
- 趋势跟踪能力:能捕捉不同时间尺度的市场动量
策略风险
- 滞后性:EMA作为滞后指标,可能对突发价格变化反应缓慢
- 假突破风险:在震荡市场中可能产生错误信号
- 多头仓位风险:金字塔式建仓可能增加整体风险敞口
策略优化方向
- 引入附加过滤条件,如成交量确认、波动率指标
- 结合止损机制,如凯利准则控制单笔交易风险
- 针对不同市场环境调整EMA参数
- 增加趋势强度评估模块
- 引入机器学习算法动态调整入场策略
总结
多重EMA交叉策略通过渐进式信号生成和直观的可视化机制,为交易者提供了一种捕捉市场趋势的系统化方法。尽管存在一定局限性,但通过持续优化和风险管理,该策略仍具有显著的实践价值。
策略源码
/*backtest
start: 2025-02-08 00:00:00
end: 2025-04-02 00:00:00
period: 1h
basePeriod: 1h
exchanges: [{"eid":"Futures_Binance","currency":"BNB_USDT"}]
*/

// This Pine Script® code is subject to the terms of the Mozilla Public License 2.0 at https://mozilla.org/MPL/2.0/
// © joll3d

//@version=5
strategy("Multi-EMA Crossover Strategy", overlay=true, initial_capital=10000, default_qty_type=strategy.percent_of_equity, pyramiding=4, default_qty_value=25)

// Calculate EMAs
ema1 = ta.ema(close, 1)
ema5 = ta.ema(close, 5)
ema3 = ta.ema(close, 3)
ema10 = ta.ema(close, 10)
ema20 = ta.ema(close, 20)
ema40 = ta.ema(close, 40)

// Define crossover conditions
longCondition1 = ta.crossover(ema1, ema5)
longCondition2 = ta.crossover(ema3, ema10)
longCondition3 = ta.crossover(ema5, ema20)
longCondition4 = ta.crossover(ema10, ema40)

shortCondition1 = ema1 < ema5
shortCondition2 = ema3 < ema10
shortCondition3 = ema5 < ema20
shortCondition4 = ema10 < ema40

// Execute long entries
if (longCondition1)
    strategy.entry("Long 1-5", strategy.long)
if (longCondition2)
    strategy.entry("Long 3-10", strategy.long)
if (longCondition3)
    strategy.entry("Long 5-20", strategy.long)
if (longCondition4)
    strategy.entry("Long 10-40", strategy.long)

if (shortCondition1)
    strategy.close("Long 1-5")
if (shortCondition2)
    strategy.close("Long 3-10")
if (shortCondition3)
    strategy.close("Long 5-20")
if (shortCondition4)
    strategy.close("Long 10-40")

// Calculate trend strength
bullishStrength = 0
bullishStrength := (ema1 > ema5 ? 1 : 0) +
                 (ema3 > ema10 ? 1 : 0) +
                 (ema5 > ema20 ? 1 : 0) +
                 (ema10 > ema40 ? 1 : 0)

//set bar colors
bullishColor = color.blue
semiBullishColor = color.rgb(175, 213, 243)
semiBearishColor = color.rgb(245, 178, 178)
bearishColor = color.red

barColor = bearishColor
if bullishStrength == 2
    barColor := semiBearishColor
if bullishStrength == 3
    barColor := semiBullishColor
if bullishStrength == 4
    barColor := bullishColor

barcolor(barColor)
相关推荐