道氏理论趋势自适应动量策略

DTTAS HH/HL LH/LL SL/TP TTS
创建日期: 2025-04-03 13:05:17 最后修改: 2025-04-03 13:05:17
复制: 0 点击次数: 115
avatar of ianzeng123 ianzeng123
2
关注
50
关注者

道氏理论趋势自适应动量策略 道氏理论趋势自适应动量策略

概述

道氏理论趋势自适应动量策略是一种基于经典道氏理论原则的先进交易方法,通过识别市场趋势的关键转折点来指导交易决策。该策略专注于检测和确认价格趋势的基本动态,利用更高高点(Higher Highs)和更高低点(Higher Lows)来定义上升趋势,利用更低高点(Lower Highs)和更低低点(Lower Lows)来定义下降趋势。这种方法旨在提供一种系统化的方法来捕捉市场趋势,并在趋势发生变化时及时做出反应。

策略原理

该策略的核心原理基于道氏理论的经典趋势识别方法。策略通过使用ta.pivothigh()和ta.pivotlow()函数来检测关键的转折点。具体实现包括以下关键步骤:

  1. 转折点检测:使用pivotLookback参数确定左右两侧的柱数,用于识别高点和低点。
  2. 趋势确认:只有当同时满足更高高点和更高低点条件时,才确认上升趋势;同样,只有当同时满足更低高点和更低低点条件时,才确认下降趋势。
  3. 趋势持续性:如果未满足趋势转换条件,策略将保持先前的趋势状态,从而实现更平滑的趋势跟踪。

策略优势

  1. 动态趋势识别:通过持续分析关键转折点,策略能够动态捕捉市场趋势变化。
  2. 灵活的交易模式:提供自动、仅做多和仅做空三种交易模式,满足不同交易者的需求。
  3. 风险管理:内置止损和止盈机制,可以有效控制单笔交易的风险。
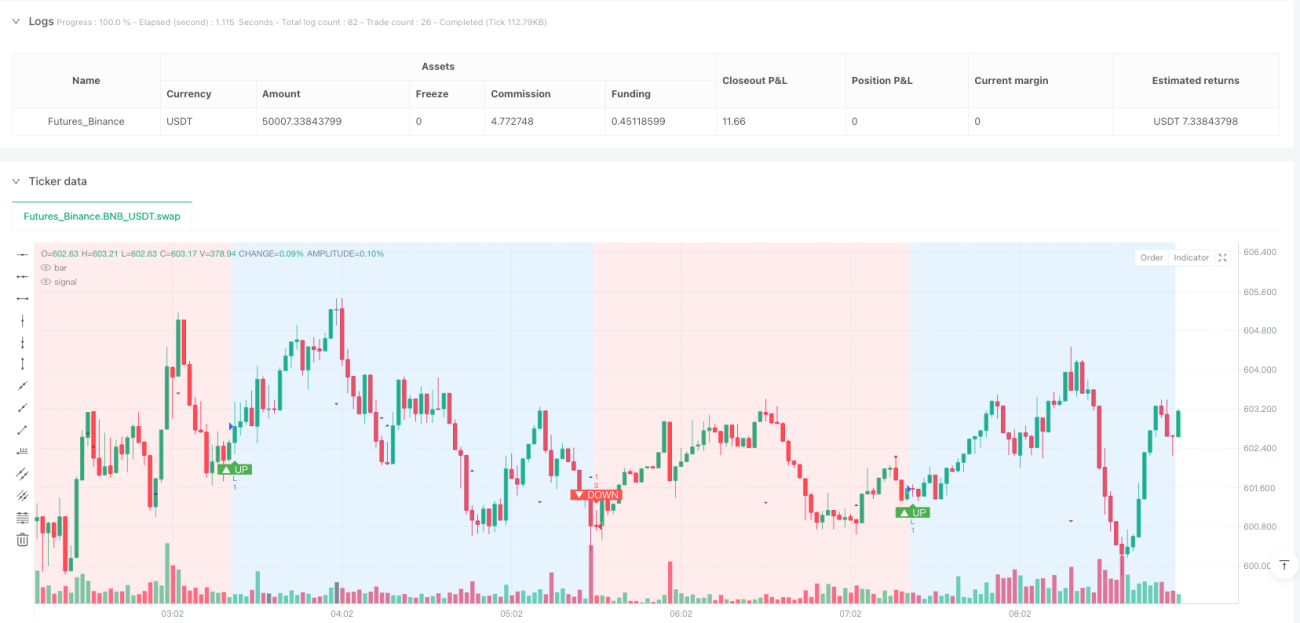
  4. 视觉化趋势:通过背景颜色和标记直观展示趋势方向,便于交易者快速理解市场状态。
  5. 低延迟:相比传统移动平均线策略,该方法能更快地响应趋势变化。

策略风险

  1. 滞后性风险:由于使用转折点检测,策略存在固有的滞后风险,可能无法捕捉趋势的最早信号。
  2. 震荡市场风险:在波动不明显的市场中,频繁的小幅度价格变动可能导致不必要的交易。
  3. 参数敏感性:pivotLookback参数的选择对策略性能影响较大,不同市场和时间框架需要调整。
  4. 交易成本:频繁交易可能导致较高的交易成本,尤其是在佣金率较高的情况下。

策略优化方向

  1. 引入附加过滤器:结合趋势强度指标(如ATR)来过滤弱势趋势信号。
  2. 动态参数调整:开发基于市场波动性的自适应pivotLookback参数机制。
  3. 多时间框架验证:在不同时间框架上交叉验证趋势信号,提高信号的可靠性。
  4. 机器学习增强:探索使用机器学习算法来优化趋势识别和入场时机。
  5. 风险管理优化:根据市场波动性动态调整止损和止盈距离。

总结

道氏理论趋势自适应动量策略是一种强大的趋势跟踪方法,通过创新的转折点分析技术,为交易者提供了一种系统化的趋势识别工具。尽管存在一些固有风险,但其灵活性和动态性使其成为现代量化交易策略中的一个有价值的方法。成功应用该策略需要深入理解其工作原理,并根据具体市场环境不断优化和调整。

Overview

The Dow Theory Trend Adaptive Momentum Strategy is an advanced trading approach based on classic Dow Theory principles, designed to guide trading decisions by identifying key turning points in market trends. The strategy focuses on detecting and confirming the fundamental dynamics of price trends, using Higher Highs and Higher Lows to define uptrends, and Lower Highs and Lower Lows to define downtrends. This method aims to provide a systematic approach to capturing market trends and responding promptly when trends change.

Strategy Principles

The core principle of this strategy is based on the classic Dow Theory trend identification method. The strategy detects key turning points using ta.pivothigh() and ta.pivotlow() functions. Specific implementation includes the following key steps:

  1. Turning Point Detection: Use the pivotLookback parameter to determine the number of bars on both sides for identifying highs and lows.
  2. Trend Confirmation: An uptrend is confirmed only when both Higher Highs and Higher Lows conditions are met; similarly, a downtrend is confirmed only when both Lower Highs and Lower Lows conditions are satisfied.
  3. Trend Persistence: If trend conversion conditions are not met, the strategy maintains the previous trend state, achieving smoother trend tracking.

Strategy Advantages

  1. Dynamic Trend Identification: By continuously analyzing key turning points, the strategy can dynamically capture market trend changes.
  2. Flexible Trading Modes: Provides three trading modes - automatic, long-only, and short-only - to meet different traders’ needs.
  3. Risk Management: Built-in stop-loss and take-profit mechanisms effectively control the risk of individual trades.
  4. Trend Visualization: Intuitively displays trend direction through background colors and markers, making it easy for traders to understand market conditions.
  5. Low Latency: Compared to traditional moving average strategies, this method can respond to trend changes more quickly.

Strategy Risks

  1. Lag Risk: Due to using pivot point detection, the strategy inherently carries a lag risk and may not capture the earliest trend signals.
  2. Ranging Market Risk: In markets with unclear fluctuations, frequent small price changes may lead to unnecessary trades.
  3. Parameter Sensitivity: The choice of pivotLookback parameter significantly impacts strategy performance and requires adjustment for different markets and timeframes.
  4. Trading Costs: Frequent trading may result in high transaction costs, especially with higher commission rates.

Strategy Optimization Directions

  1. Introduce Additional Filters: Combine trend strength indicators (such as ATR) to filter weak trend signals.
  2. Dynamic Parameter Adjustment: Develop an adaptive pivotLookback parameter mechanism based on market volatility.
  3. Multi-Timeframe Verification: Cross-verify trend signals across different timeframes to improve signal reliability.
  4. Machine Learning Enhancement: Explore using machine learning algorithms to optimize trend identification and entry timing.
  5. Risk Management Optimization: Dynamically adjust stop-loss and take-profit distances based on market volatility.

Conclusion

The Dow Theory Trend Adaptive Momentum Strategy is a powerful trend-following method that provides traders with a systematic trend identification tool through innovative turning point analysis techniques. Despite some inherent risks, its flexibility and dynamism make it a valuable approach in modern quantitative trading strategies. Successfully applying this strategy requires a deep understanding of its working principles and continuous optimization and adjustment based on specific market environments.

策略源码
/*backtest
start: 2025-03-29 00:00:00
end: 2025-03-30 09:00:00
period: 2m
basePeriod: 2m
exchanges: [{"eid":"Futures_Binance","currency":"BNB_USDT"}]
*/

//@version=5
// strategy(title="Dow Theory Trend Strategy v3", shorttitle="Dow Trend Strat v3", overlay=true,
//      initial_capital=10000, default_qty_type=strategy.percent_of_equity, default_qty_value=10,
//      commission_type=strategy.commission.percent, commission_value=0.1, // Example strategy settings with commission
//      process_orders_on_close=true) // Consider processing on bar close for more stable backtests
strategy(title="Dow Theory Trend Strategy v3", shorttitle="Dow Trend Strat v3", overlay=true) // Basic strategy settings

// --- 設定 ---
// Calculation Settings
pivotLookback = input.int(10, title="Pivot Lookback Period", minval=1, tooltip="ピボットハイ/ローを検出するための左右のバーの数", group="Calculation Settings")

// Display Settings
showPivotPoints = input.bool(true, title="Show Pivot Points", tooltip="ピボットハイ/ローのポイントを表示します", group="Display Settings")
showTrendChange = input.bool(true, title="Show Trend Change Signals", tooltip="トレンド転換のシグナル(エントリーポイント)を表示します", group="Display Settings")

// Strategy Settings
// --- Manual Trend Override (配列定義を input 内に変更) ---
manualTrendMode = input.string("Auto", title="Manual Trend Mode",
     options=["Auto", "Long Only", "Short Only"], // オプションをここで直接定義
     tooltip="手動でトレード方向を指定 (Auto: ダウ理論に従う, Long Only: ロングのみ, Short Only: ショートのみ)",
     group="Strategy Settings")

// Risk Management Settings
useStopLoss = input.bool(true, title="Use Stop Loss", group="Risk Management")
stopLossTicks = input.float(100, title="Stop Loss (Ticks)", minval=1, group="Risk Management", tooltip="エントリー価格からのストップロスまでのティック(最小値動き)数。例:EURUSDで20 pips (tick=0.00001)なら200。")
useTakeProfit = input.bool(true, title="Use Take Profit", group="Risk Management")
takeProfitTicks = input.float(200, title="Take Profit (Ticks)", minval=1, group="Risk Management", tooltip="エントリー価格からのテイクプロフィットまでのティック(最小値動き)数。例:EURUSDで40 pips (tick=0.00001)なら400。")

// --- ピボットハイ/ローの検出 ---
pivotHighPrice = ta.pivothigh(high, pivotLookback, pivotLookback)
pivotLowPrice = ta.pivotlow(low, pivotLookback, pivotLookback)

// --- ピボットポイントの値を保持するための変数 ---
var float lastPivotHigh = na
var float prevPivotHigh = na
var float lastPivotLow = na
var float prevPivotLow = na
var int lastPivotHighBar = na
var int prevPivotHighBar = na
var int lastPivotLowBar = na
var int prevPivotLowBar = na

// --- 新しいピボットが確定したかどうかの検出と値の更新 ---
if not na(pivotHighPrice)
    if na(lastPivotHigh) or pivotHighPrice != lastPivotHigh
        prevPivotHigh := lastPivotHigh
        prevPivotHighBar := lastPivotHighBar
        lastPivotHigh := pivotHighPrice
        lastPivotHighBar := bar_index - pivotLookback

if not na(pivotLowPrice)
    if na(lastPivotLow) or pivotLowPrice != lastPivotLow
        prevPivotLow := lastPivotLow
        prevPivotLowBar := lastPivotLowBar
        lastPivotLow := pivotLowPrice
        lastPivotLowBar := bar_index - pivotLookback

// --- ダウ理論に基づくトレンド判定 (改良版) ---
var int trendDirection = 0
bool hasEnoughPivots = not na(lastPivotHigh) and not na(prevPivotHigh) and not na(lastPivotLow) and not na(prevPivotLow)

if hasEnoughPivots
    isHigherHigh = lastPivotHigh > prevPivotHigh
    isHigherLow = lastPivotLow > prevPivotLow
    isUptrendConfirmed = isHigherHigh and isHigherLow

    isLowerHigh = lastPivotHigh < prevPivotHigh
    isLowerLow = lastPivotLow < prevPivotLow
    isDowntrendConfirmed = isLowerHigh and isLowerLow

    if isUptrendConfirmed
        trendDirection := 1
    else if isDowntrendConfirmed
        trendDirection := -1
    else
        trendDirection := trendDirection[1]

// --- トレンド転換の検出 ---
bool trendChanged = ta.change(trendDirection) != 0
bool changedToUp = trendChanged and trendDirection == 1
bool changedToDown = trendChanged and trendDirection == -1

// --- 描画処理 ---
bgcolor(trendDirection == 1 ? color.new(color.blue, 85) : trendDirection == -1 ? color.new(color.red, 85) : color.new(color.gray, 90), title="Trend Background")
plotshape(showPivotPoints and not na(pivotHighPrice), title="Pivot High", location=location.abovebar, color=color.new(color.maroon, 20), style=shape.triangledown, size=size.tiny, offset=-pivotLookback)
plotshape(showPivotPoints and not na(pivotLowPrice), title="Pivot Low", location=location.belowbar, color=color.new(color.navy, 20), style=shape.triangleup, size=size.tiny, offset=-pivotLookback)
plotshape(showTrendChange and changedToUp, title="Uptrend Start Signal", location=location.belowbar, color=color.new(color.green, 0), style=shape.labelup, text="▲ UP", textcolor=color.white, size=size.small)
plotshape(showTrendChange and changedToDown, title="Downtrend Start Signal", location=location.abovebar, color=color.new(color.red, 0), style=shape.labeldown, text="▼ DOWN", textcolor=color.white, size=size.small)

// --- ストラテジーロジック ---
bool allowLong = manualTrendMode == "Auto" or manualTrendMode == "Long Only"
bool allowShort = manualTrendMode == "Auto" or manualTrendMode == "Short Only"

if (changedToUp and allowLong)
    strategy.entry("L", strategy.long, comment="Go Long")
    if (useStopLoss or useTakeProfit)
        float slValue = useStopLoss and stopLossTicks > 0 ? stopLossTicks : na
        float tpValue = useTakeProfit and takeProfitTicks > 0 ? takeProfitTicks : na
        strategy.exit("LX", from_entry="L", loss=slValue, profit=tpValue, comment_loss="SL Long", comment_profit="TP Long")

if (changedToDown and allowShort)
    strategy.entry("S", strategy.short, comment="Go Short")
    if (useStopLoss or useTakeProfit)
        float slValue = useStopLoss and stopLossTicks > 0 ? stopLossTicks : na
        float tpValue = useTakeProfit and takeProfitTicks > 0 ? takeProfitTicks : na
        strategy.exit("SX", from_entry="S", loss=slValue, profit=tpValue, comment_loss="SL Short", comment_profit="TP Short")

// --- デバッグ用 ---
// plot(trendDirection, title="Trend Direction Value")
相关推荐