EMA双重交叉动态止损量化策略
EMA CROSSOVER STOP-LOSS TREND FOLLOWING TECHNICAL INDICATORS
创建日期:
2025-04-24 16:59:03
最后修改:
2025-04-24 16:59:03
复制:
9
点击次数:
391


概述
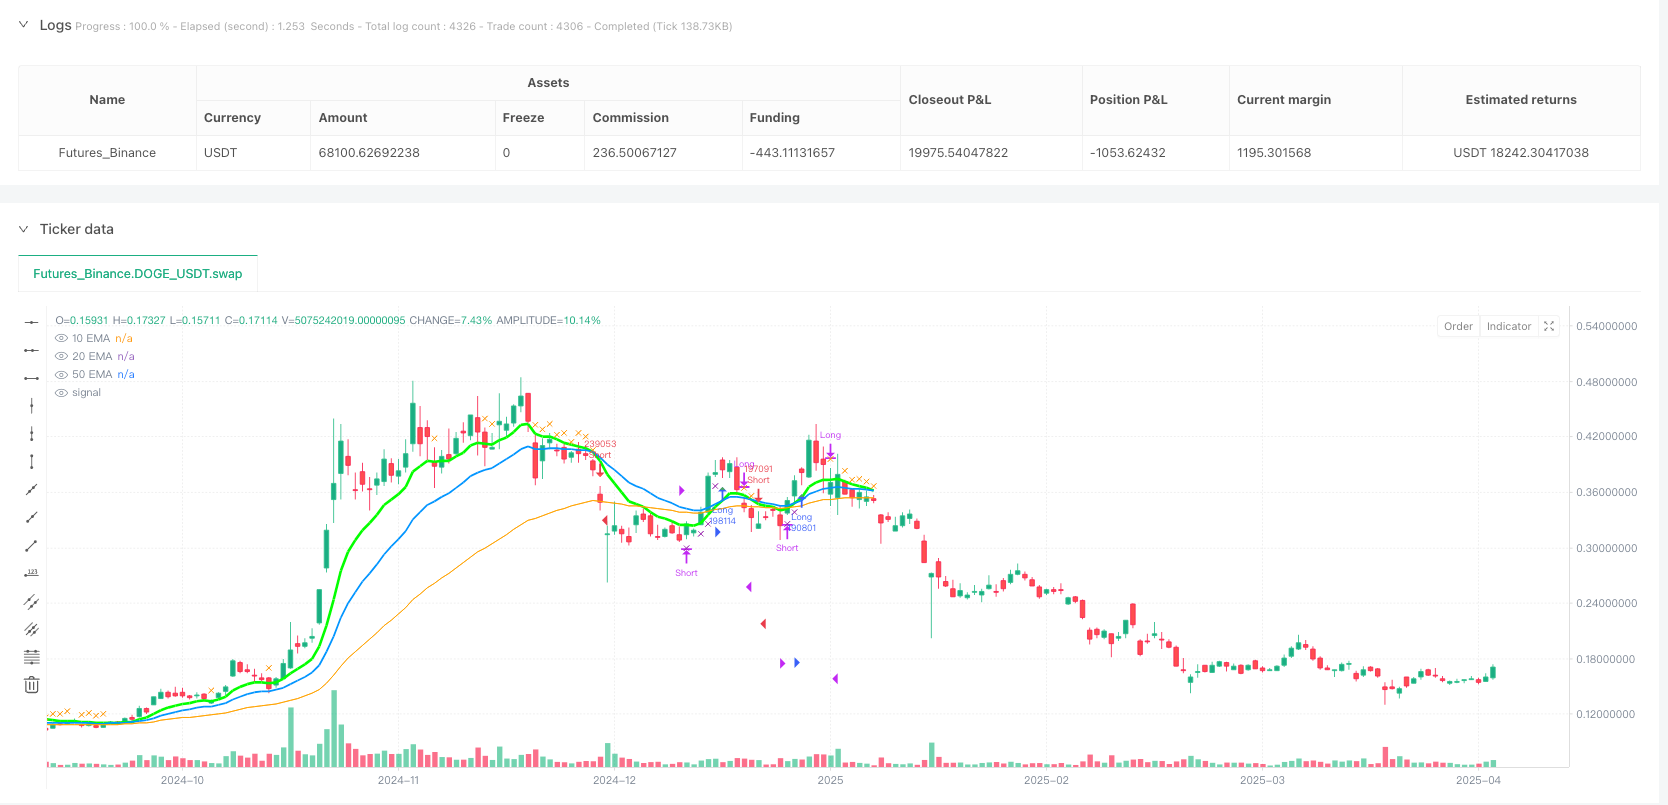
该策略基于指数移动平均线(EMA)的双重交叉原理,结合动态止损机制设计而成。策略通过10日EMA与20日EMA的金叉/死叉作为主要交易信号,并以50日EMA作为趋势过滤器,同时采用10日EMA作为动态止损线。当价格在50日EMA上方且10日EMA上穿20日EMA时产生买入信号;当价格在50日EMA下方且10日EMA下穿20日EMA时产生卖出信号。持仓期间若价格反向突破10日EMA则触发止损退出。
策略原理
- 多空条件判断:
- 多头条件:当10日EMA从下方穿越20日EMA(金叉),且当前收盘价高于50日EMA时,确认多头趋势成立。
- 空头条件:当10日EMA从上方穿越20日EMA(死叉),且当前收盘价低于50日EMA时,确认空头趋势成立。
- 多头条件:当10日EMA从下方穿越20日EMA(金叉),且当前收盘价高于50日EMA时,确认多头趋势成立。
- 动态止损机制:
- 多头持仓期间,若收盘价跌破10日EMA,则触发止损平仓。
- 空头持仓期间,若收盘价升破10日EMA,则触发止损平仓。
- 多头持仓期间,若收盘价跌破10日EMA,则触发止损平仓。
- 趋势过滤:50日EMA作为长期趋势过滤器,避免在震荡行情中频繁交易。
优势分析
- 趋势跟踪能力:双重EMA交叉能有效捕捉中期趋势,50日EMA过滤减少假信号。
- 动态风险管理:10日EMA作为动态止损线,可随趋势调整退出点位,保护利润。
- 可视化设计:通过不同颜色和线宽区分三条EMA,并标注买卖信号,便于实时监控。
- 参数可调性:EMA周期可通过输入参数灵活调整,适应不同市场波动率。
风险分析
- 滞后性风险:EMA基于历史数据计算,在快速反转行情中可能产生较大回撤。
- 解决方案:结合动量指标(如RSI)过滤极端波动。
- 解决方案:结合动量指标(如RSI)过滤极端波动。
- 震荡市亏损:在无趋势行情中,交叉信号可能频繁触发无效交易。
- 解决方案:引入波动率指标(如ATR)暂停交易。
- 解决方案:引入波动率指标(如ATR)暂停交易。
- 参数过拟合:固定EMA周期可能不适应所有市场状态。
- 解决方案:采用自适应周期算法或多时间框架验证。
- 解决方案:采用自适应周期算法或多时间框架验证。
优化方向
- 复合信号增强:
- 增加成交量确认(如突破时放量),提升信号可靠性。
- 增加成交量确认(如突破时放量),提升信号可靠性。
- 动态仓位管理:
- 根据波动率(ATR值)调整仓位大小,降低高风险时段暴露。
- 根据波动率(ATR值)调整仓位大小,降低高风险时段暴露。
- 机器学习优化:
- 使用历史数据训练模型,动态优化EMA周期组合。
- 使用历史数据训练模型,动态优化EMA周期组合。
- 多时间框架验证:
- 要求周线级别EMA方向与日线信号一致,提高胜率。
- 要求周线级别EMA方向与日线信号一致,提高胜率。
总结
本策略通过EMA双重交叉与动态止损的结合,实现了趋势跟踪与风险控制的平衡。其核心优势在于清晰的逻辑结构和直观的可视化设计,适合中低频交易场景。未来可通过引入更多维度的市场数据(如波动率、成交量)进一步提升稳健性。
策略源码
/*backtest
start: 2024-04-24 00:00:00
end: 2025-04-23 00:00:00
period: 1d
basePeriod: 1d
exchanges: [{"eid":"Futures_Binance","currency":"DOGE_USDT"}]
*/

//@version=5
//@description Ovtlyer EMA Crossover  price over 50 Indicator
//@author YourName

strategy("EMA Crossover Strategy", overlay=true, default_qty_type=strategy.percent_of_equity, default_qty_value=100)

// Input EMA lengths
length10 = input.int(10, minval=1, title="10 EMA Length")
length20 = input.int(20, minval=1, title="20 EMA Length")
length50 = input.int(50, minval=1, title="50 EMA Length")

// Calculate EMAs
ema10 = ta.ema(close, length10)
ema20 = ta.ema(close, length20)
ema50 = ta.ema(close, length50)

// Bullish Condition: 10 EMA crosses above 20 EMA AND price is above 50 EMA
bullishCondition = ta.crossover(ema10, ema20) and close > ema50

// Bearish Condition: 10 EMA crosses below 20 EMA AND price is below 50 EMA
bearishCondition = ta.crossunder(ema10, ema20) and close < ema50

// Track the current market state
var isBullish = false
var isBearish = false

if (bullishCondition)
    isBullish := true
    isBearish := false

if (bearishCondition)
    isBearish := true
    isBullish := false

// Exit conditions
bullishExit = isBullish and close < ema10
bearishExit = isBearish and close > ema10

// Plot EMAs
plot(ema10, title="10 EMA", color=color.rgb(0, 255, 0), linewidth=3) // Thick green line for 10 EMA
plot(ema20, title="20 EMA", color=color.rgb(0, 150, 255), linewidth=2) // Medium blue line for 20 EMA
plot(ema50, title="50 EMA", color=color.rgb(255, 165, 0), linewidth=1) // Thin orange line for 50 EMA

// Strategy Entry and Exit
if (bullishCondition)
    strategy.entry("Long", strategy.long)

if (bearishCondition)
    strategy.entry("Short", strategy.short)

if (bullishExit)
    strategy.close("Long")

if (bearishExit)
    strategy.close("Short")

// Plot Entry Signals (for visualization)
plotshape(bullishCondition, title="Bullish Signal",
          location=location.belowbar, style=shape.triangleup,
          size=size.small, color=color.green)
plotshape(bearishCondition, title="Bearish Signal",
          location=location.abovebar, style=shape.triangledown,
          size=size.small, color=color.red)

// Plot Exit Signals (for visualization)
plotshape(bullishExit, title="Bullish Exit",
          location=location.abovebar, style=shape.xcross,
          size=size.small, color=color.orange)
plotshape(bearishExit, title="Bearish Exit",
          location=location.belowbar, style=shape.xcross,
          size=size.small, color=color.purple)
相关推荐