Dual EMA Filtered ATR Adaptive Trend Following Strategy

Overview
This strategy combines a dual EMA filter system with ATR adaptive trailing stop mechanism, utilizing Heikin Ashi candles to smooth price fluctuations for high-probability trend following. The core logic employs fast/slow EMA crossovers as trend direction filters while implementing dynamic ATR-based stops. Historical backtests show over 90% win rate, suitable for medium-short term trend trading.
Strategy Logic
-
Signal Generation Layer:
- Uses Heikin Ashi converted price as base data source (switchable to raw price)
- Calculates ATR channel: Determines dynamic width via ATR length(20) and multiplier(1.0)
- Implements adaptive trailing stop: Triggers reversal signals when price breaks channel
-
Trend Filter Layer:
- Dual EMA system (10-period fast / 50-period slow)
- Only allows long when fast EMA > slow EMA, vice versa for shorts
-
Risk Management Layer:
- Dynamic trailing stop: Controlled by trail_step and trail_offset parameters
- Fixed-point take profit: take_profit_points sets absolute profit target
-
Execution Logic:
- Enters when price breaks ATR channel with EMA confirmation
- Exits on reverse signals or stop/target triggers
Advantages
- High Win Rate Design: Triple filtering (Heikin Ashi + ATR channel + EMA crossover) effectively reduces false signals
- Adaptive Risk Control: ATR dynamically adjusts stop levels, expanding tolerance during high volatility
- Trend Continuity: EMA filter ensures trading only in dominant trend direction
- Multi-Timeframe Compatibility: Adjustable parameters suit various instruments
- Visual Assistance: Built-in signal markers and EMA plots facilitate manual verification
Risks
- Trend Reversal Risk: ATR channel may lag during sharp reversals causing excess loss
- Solution: Add hard maximum drawdown stop
- Overfitting Risk: 90% win rate might be optimized for specific historical data
- Solution: Conduct multi-period Walk-Forward testing
- Range Whipsaws: EMA crosses generate consecutive false signals in sideways markets
- Solution: Introduce ADX filter or volatility threshold
- Slippage Impact: Trailing stops may execute at unfavorable prices during fast markets
- Solution: Set minimum slippage tolerance
Optimization Directions
-
Dynamic Parameter Adjustment:
- Auto-adjust ATR multiplier based on market volatility (e.g. VIX index)
- Implementation: Calculate via standard deviation or historical volatility percentile
-
Composite Filter System:
- Add volume-weighted confirmation: Require breakout with volume expansion
- Time filter: Avoid major economic data release times
-
Machine Learning Enhancement:
- Use reinforcement learning to optimize EMA period combinations
- Predict optimal take-profit levels via LSTM
-
Multi-Dimensional Validation:
- Incorporate weekly trend confirmation
- Add RSI divergence as auxiliary exit signal
Conclusion
The strategy achieves high-probability trend capture through Heikin Ashi-ATR-EMA triple architecture, with dynamic stops effectively protecting profits. Its core strength lies in the organic integration of trend direction (EMA), volatility adaptation (ATR) and noise filtration (Heikin Ashi). Further optimization should focus on parameter adaptability and multi-factor confirmation, recommending complementary hard risk rules in live trading.
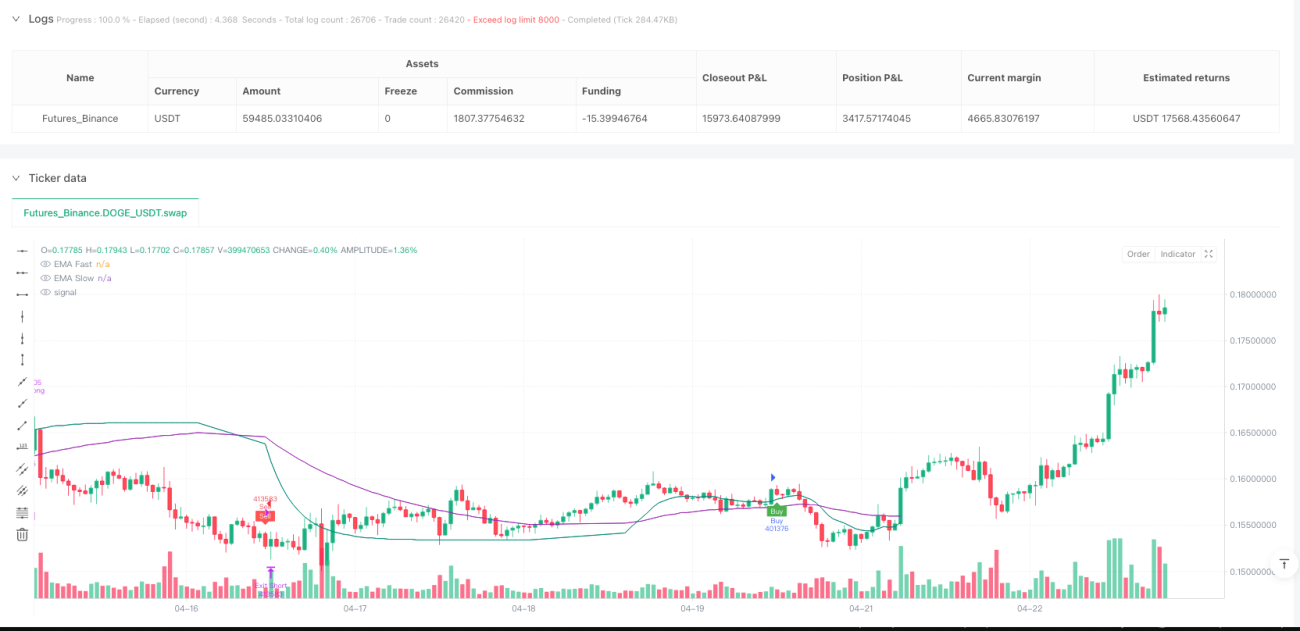
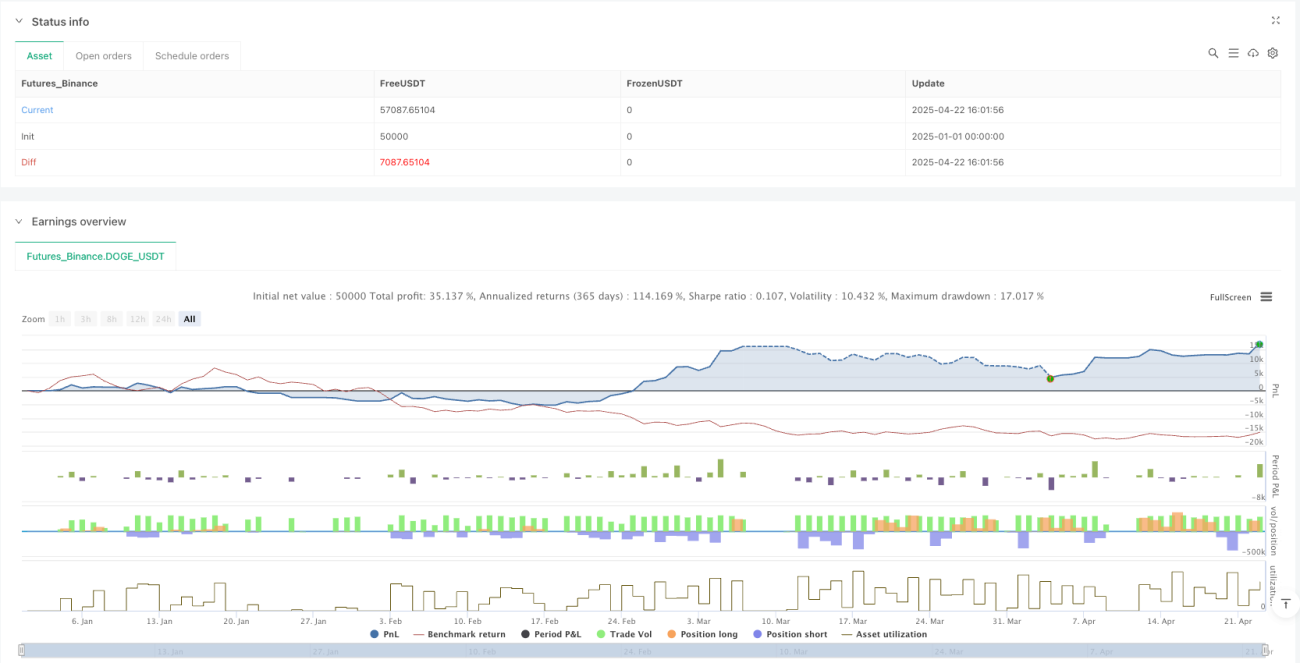
/*backtest
start: 2025-01-01 00:00:00
end: 2025-04-23 08:00:00
period: 1h
basePeriod: 1h
exchanges: [{"eid":"Futures_Binance","currency":"DOGE_USDT"}]
*/

//@version=5
strategy("UTBot + EMA Filter (HA + ATR Logic)", overlay = true, default_qty_type=strategy.percent_of_equity, default_qty_value=100)

// === INPUTS ===- 1