
1. The Starting Point: Trump Drawing Candlesticks by Hand
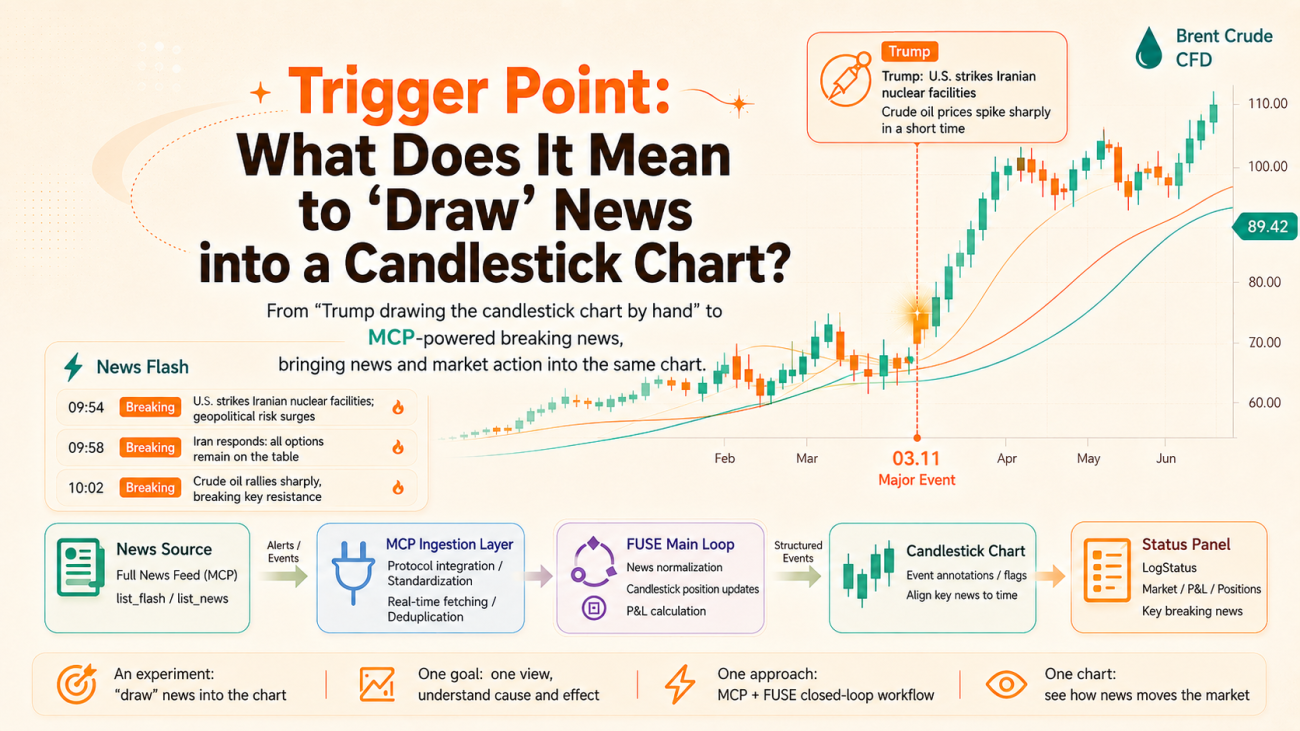
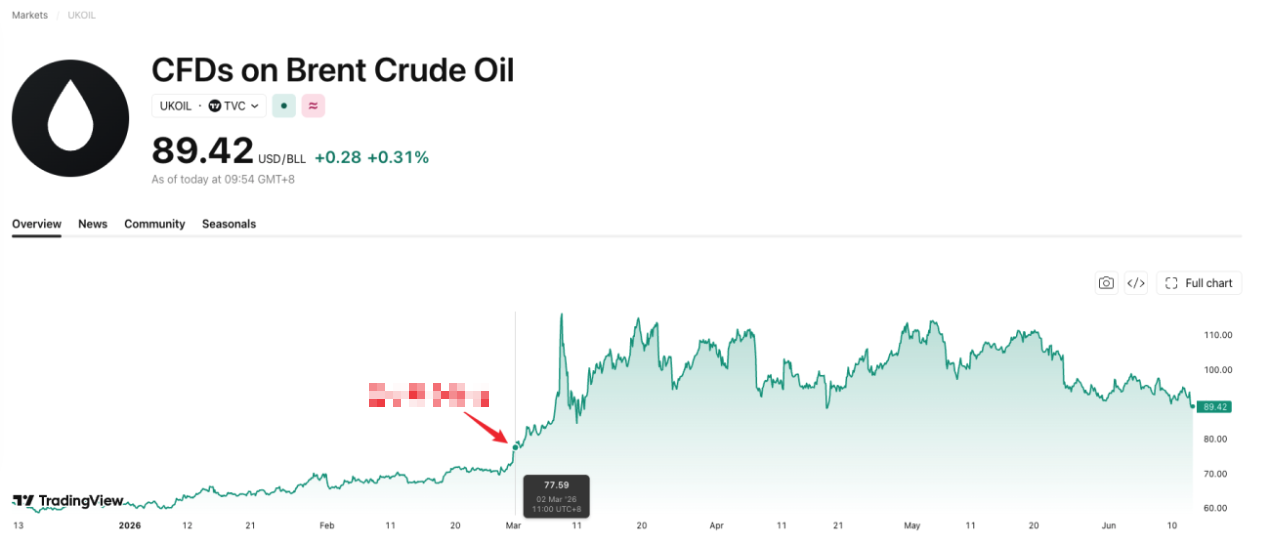
The time-sensitivity of news needs no argument. When word broke that the U.S. had carried out airstrikes on Iran, crude oil spiked violently in a very short window — and throughout that move, factors like the statements from Trump and from Iran kept interweaving and reinforcing one another, pushing the market into one new range after another.
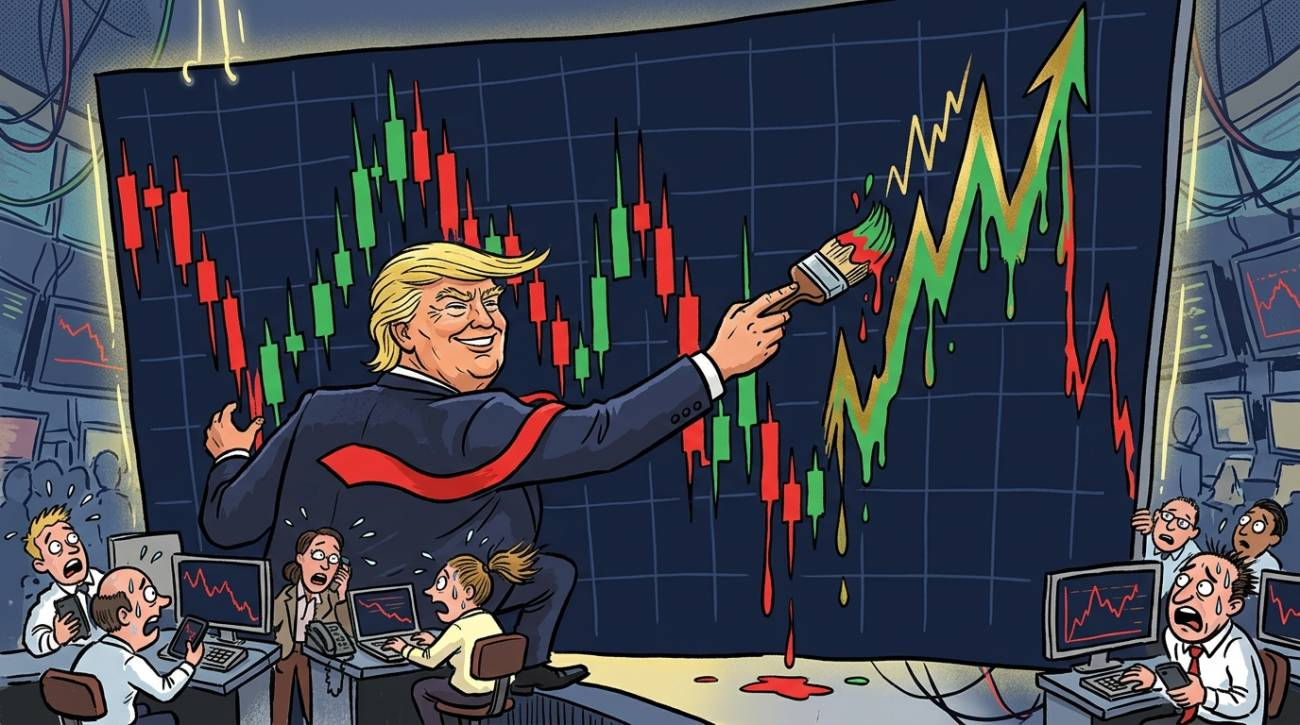
We often joke that "Trump draws the candlesticks by hand" — much of the time, a violent price swing isn't something that evolved out of technical indicators at all; it's punched straight into the chart by a single tweet, a single speech, a single policy remark. Technical analysis tells you "where we are right now," but the news is often the key variable behind "why we got here, and where we might go next."
The importance of news is beyond dispute, but the problem is just as real: a human can't stare at the charts and the newswire 24 hours a day, and it's even harder to be the first to catch — in a flood of information — the one headline that will actually move the market. So a very plain idea surfaced: could we "draw" the news directly onto the candlestick chart, so that price and news are presented in the same view at the same time? At the very least, let's first solve the problem of seeing it.
2. Choosing a News Source: Connecting to Jin10 via MCP
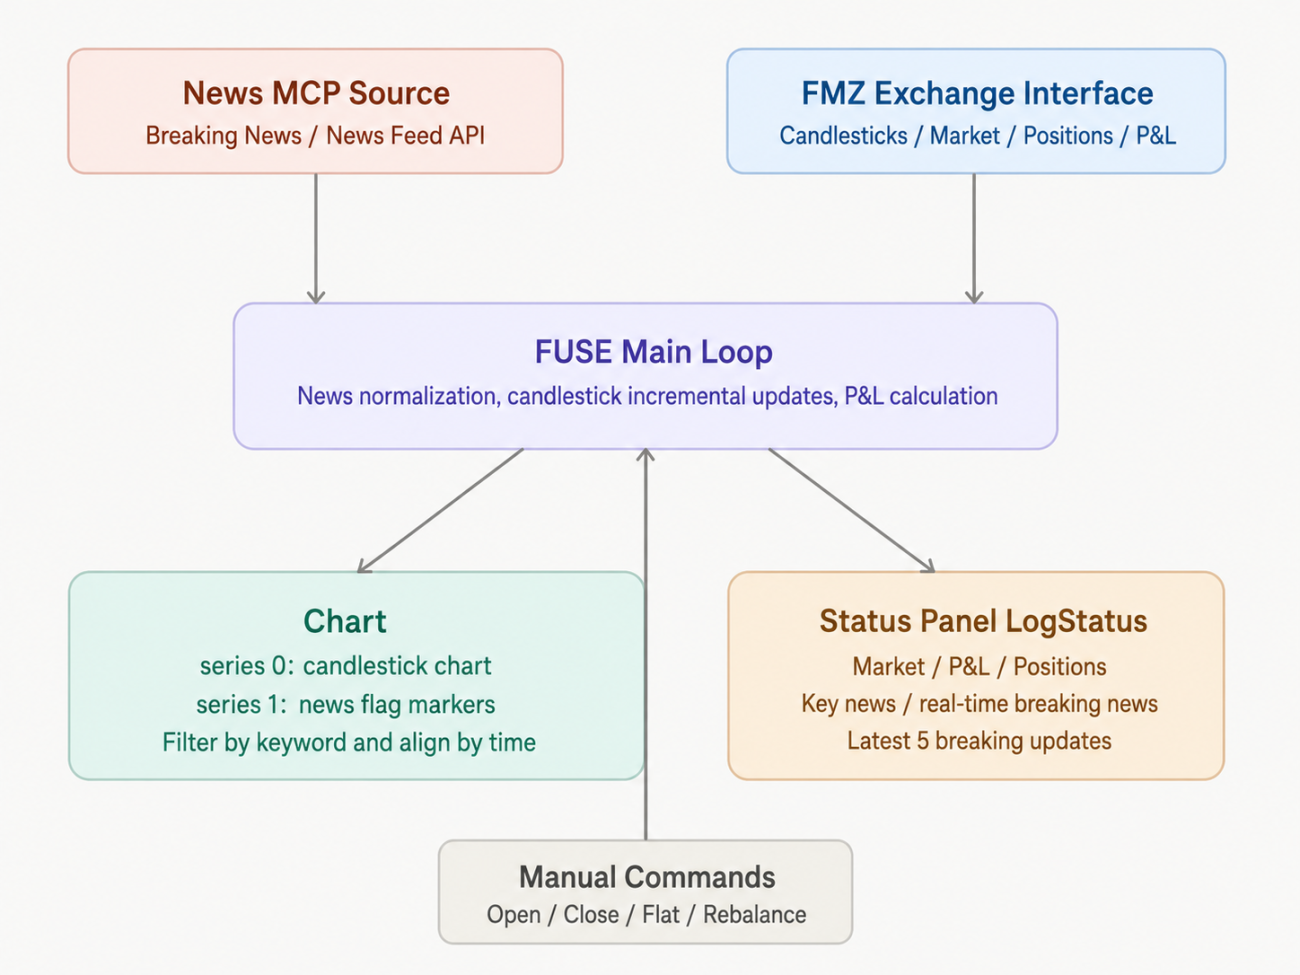
To pipe news in, the first step is finding a source that updates fast enough and has a relatively standardized structure. This time we went with Jin10 Data (a Chinese financial newswire), connected via MCP (Model Context Protocol), calling two kinds of endpoints: list_flash (flash news) and list_news (longer-form articles).
I don't intend to spend much space introducing Jin10 itself — it's just one option we happen to be using right now. The approach is decoupled from any specific news source: as long as a source can provide timestamped headlines/bodies and can be called via a standard mechanism like MCP, it can be swapped in. The point is the design of this ingestion layer, not being locked to any one particular tool.
MCP's connection and session management is one of the more "low-level" but also critical pieces of this system:
python
def _mcp_post(payload, is_notification=False):
global _mcp_session_id, _mcp_req_id
if not is_notification:
_mcp_req_id += 1
payload["id"] = _mcp_req_id
body = json.dumps(payload, ensure_ascii=False).encode()
req = urllib.request.Request(
JIN10_MCP_URL, data=body, headers=_mcp_headers(), method="POST"
)
try:
with urllib.request.urlopen(req, timeout=30) as resp:
sid = resp.headers.get("Mcp-Session-Id")
if sid:
_mcp_session_id = sid
if resp.status == 202:
return {}
text = resp.read().decode("utf-8", errors="replace")
except urllib.error.HTTPError as e:
raise RuntimeError("HTTP %d: %s" % (e.code, e.read().decode()[:400]))
except urllib.error.URLError as e:
raise RuntimeError("Network: " + str(e))
return _mcp_parse(text)
def mcp_init():
global _mcp_ready
mcp_rpc("initialize", {
"protocolVersion": "2025-11-25",
"capabilities": {},
"clientInfo": {"name": "fuse-fmz", "version": "1.0"},
})
mcp_notify("notifications/initialized")
_mcp_ready = True
Log("MCP ready session_id=" + (_mcp_session_id or "(none)"))
Once the session is established, pulling news is just two tool calls, followed by unified format normalization and deduplication:
            python

            def refresh_news():
    global _cached_news, _last_news_at, _mcp_ready
    if not JIN10_MCP_TOKEN:
        return
    now = int(time.time())
    if now - _last_news_at < NEWS_REFRESH_SEC and _cached_news:
        return
    _last_news_at = now
    try:
        if not _mcp_ready:
            mcp_init()
        flash_raw = mcp_call_tool("list_flash")
        news_raw  = mcp_call_tool("list_news")
        combined  = (
            _normalize(_extract_items(flash_raw), "flash") +
            _normalize(_extract_items(news_raw),  "news")
        )
        combined.sort(key=lambda x: x["ts"], reverse=True)
        _cached_news = combined[:80]
        Log("News updated: %d items" % len(_cached_news))
    except Exception as e:
        Log("News refresh failed: " + str(e))
        _mcp_ready = False
Different news sources return wildly varying field names (title/content/introduction, time/ts/created_at, and so on), so we added a middle layer of _extract_items + _normalize to coerce all the various formats into a standard structure of {ts, time, title, source, full_text}. That way the downstream charting and filtering logic doesn't have to care which endpoint the data actually came from.
Note: you need to apply for an MCP API before you can use this.
3. The Core Idea: Making News "Grow" on the Candlesticks
Next is the part of this tool that's actually interesting — putting news and candlesticks on the same chart.
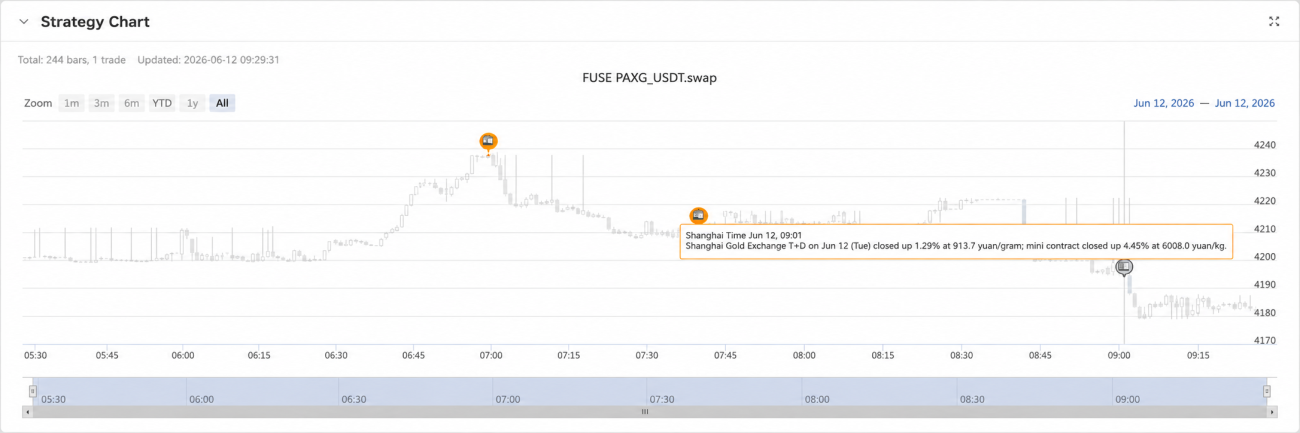
We added a second series to the chart, of type flags, attached to the candlestick series, acting as the "news marker layer":
            python

            def init_chart(symbol):
    global _chart
    _chart = Chart({
        "__isStock": True,
        "chart":     {"style": {"fontFamily": "Microsoft YaHei, SimHei, Arial, sans-serif"}},
        "title":     {"text": "FUSE  " + symbol},
        "xAxis":     {"type": "datetime"},
        "series": [
            {
                "id":   "kline",
                "type": "candlestick",
                "name": symbol,
                "data": [],
            },
            {
                "type":      "flags",
                "name":      "News",
                "onSeries":  "kline",
                "shape":     "circlepin",
                "color":     "#F59E0B",
                "fillColor": "#F59E0B",
                "width":     16,
                "data":      [],
            },
        ],
    })
    _chart.reset()
On each refresh, we first incrementally update the candlestick data, then filter out the "important" news by keyword and align it in time to the corresponding candlestick bar:
            python

            def draw_chart(records):
    global _last_bar_time, _last_news_hash, _flagged_news_ts

    if not _chart or not records:
        return

    # Detect whether the news has updated; if so, reset and redraw the chart
    news_hash = hash(tuple(n.get("ts", 0) for n in _cached_news[:10]))
    news_changed = (news_hash != _last_news_hash)
    if news_changed:
        _chart.reset()
        _last_bar_time   = 0
        _last_news_hash  = news_hash
        _flagged_news_ts = set()

    # series 0: candlesticks, incremental add
    for r in records:
        t   = r['Time']
        bar = [t, r['Open'], r['High'], r['Low'], r['Close']]
        if t > _last_bar_time:
            _chart.add(0, bar)
            _last_bar_time = t
        elif t == _last_bar_time:
            _chart.add(0, bar, -1)

    # series 1: keyword-news flags, aligned to the candlestick bar time
    if not _cached_news:
        return
    kws = [k.strip() for k in NEWS_KEYWORD.split("|") if k.strip()]
    kw_news = [n for n in _cached_news if not kws or any(k in n.get("full_text", n["title"]) for k in kws)]
    if not kw_news:
        return
    p_ms  = PERIOD_MS.get(KLINE_PERIOD, 60000)
    first = records[0]['Time']
    last  = records[-1]['Time']
    by_bar = {}
    for n in kw_news:
        if not n.get("ts"):
            continue
        key = (n["ts"] // p_ms) * p_ms
        if key not in by_bar:
            by_bar[key] = n

    for ts, item in sorted(by_bar.items()):
        if not (first <= ts <= last):
            continue
        if ts in _flagged_news_ts:
            continue
        _chart.add(1, {
            "x": ts,
            "title": "📰",
            "text": item["title"][:100],
        })
        _flagged_news_ts.add(ts)
The effect: every time a 📰 marker appears on the chart, hovering over it shows you the corresponding headline, and its position sits exactly on the candlestick bar for the time that piece of news broke. For the first time, the price's turning points and the news's timestamps are laid out in an intuitive way on the same canvas — you no longer have to switch between two windows to figure out "what caused this stretch."
NEWS_KEYWORD supports multiple keywords separated by | (e.g. "Iran|rate hike|nonfarm|tariffs"); the system prioritizes flagging news that matches a keyword onto the chart, preventing the chart from being spammed by irrelevant flash items.
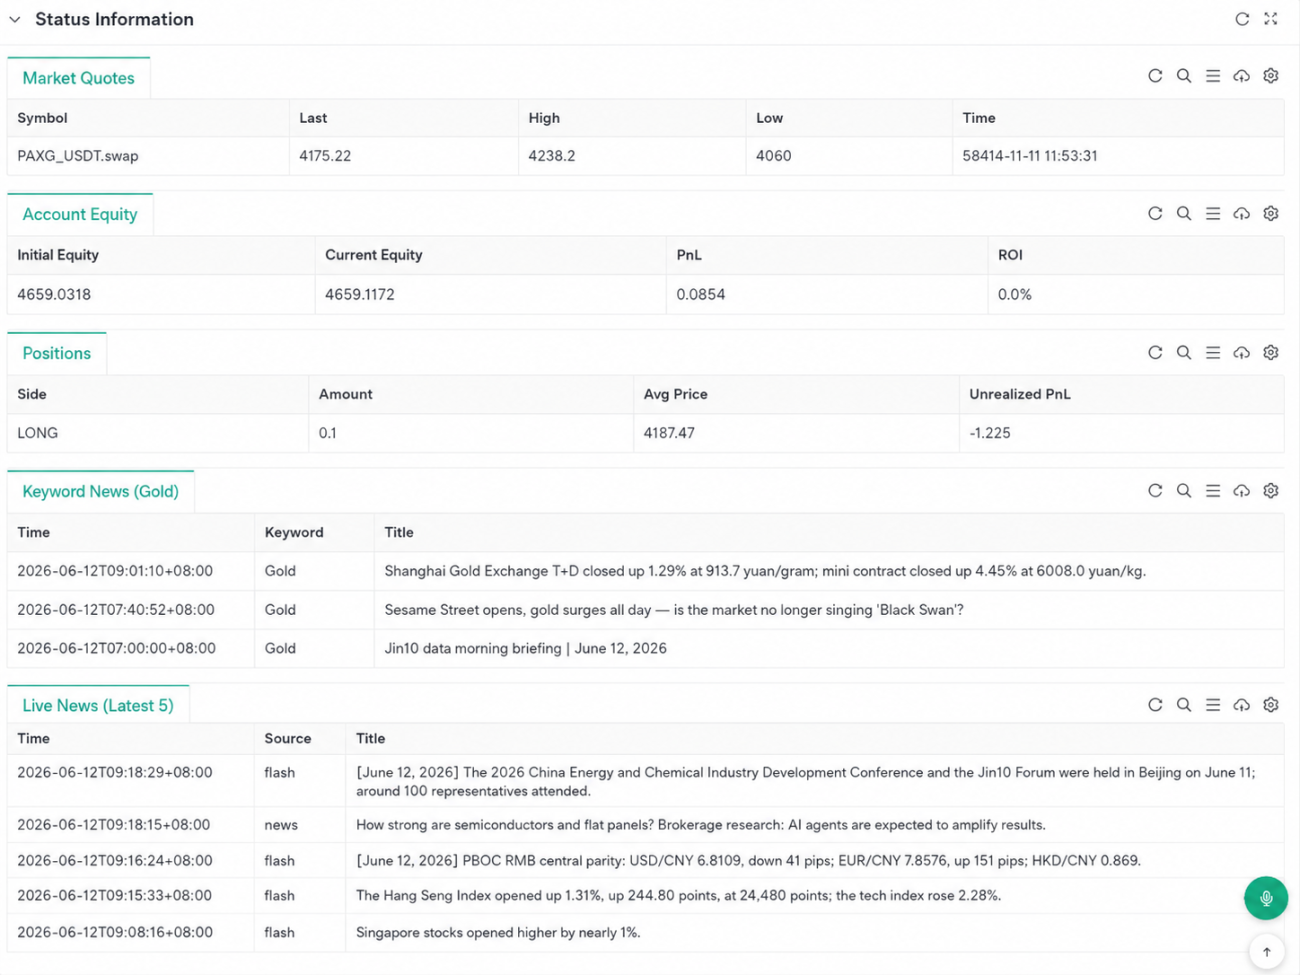
4. The Status Panel: Quotes, Positions, and News on One Screen
Besides the chart, we also built a set of status tables, output via LogStatus, covering live quotes, account equity and P&L, current positions, keyword-matched news, and the latest full feed of flash news:
            python

            def make_status(symbol, ticker, positions, equity):
    # 4. Keyword news (show the matched keywords, not the source)
    kws = [k.strip() for k in NEWS_KEYWORD.split("|") if k.strip()]
    kw_rows = []
    for item in _cached_news[:40]:
        t     = item.get("time") or (_D(item["ts"]) if item.get("ts") else "-")
        title = item["title"][:90]
        text  = item.get("full_text", item["title"])
        hit_kws = [k for k in kws if k in text]
        if hit_kws:
            kw_rows.append([t, "/".join(hit_kws), title])

    if not kw_rows:
        kw_rows = [["-", "-", "No keyword-related news yet"]]
Plus a simple manual command interface — open long, open short, close long, close short, one-click close-all, and adjust order size — all received via GetCommand():
            python

            def handle_command(symbol):
    global _cur_amount, _last_news_at
    cmd = GetCommand()
    if not cmd:
        return
    Log("CMD: " + cmd)
    parts = cmd.split(":")
    key   = parts[0]
    val   = parts[1] if len(parts) > 1 else ""
    if   key == "openLong":    market_order(symbol, "openLong",   _cur_amount)
    elif key == "openShort":   market_order(symbol, "openShort",  _cur_amount)
    elif key == "closeLong":   market_order(symbol, "closeLong",  _cur_amount)
    elif key == "closeShort":  market_order(symbol, "closeShort", _cur_amount)
    elif key == "closeAll":    close_all(symbol)
    elif key == "amount":
        _cur_amount = float(val)
        Log("Amount updated: " + str(_cur_amount))
Taken together, FUSE is essentially an "information aggregation + manual execution" monitoring panel: it tries to put price, news, positions, and account status on the same screen, while the decision still rests entirely with the human. It won't judge for you — it just tries to make sure you overlook a little less when you do.
5. Limitations: The Human Is Still the Biggest Variable
The limitations of this version are honestly quite obvious, and we don't want to dodge them.
First, the mapping between news and price is "coarse-grained" — it only hangs the news onto the corresponding candlestick bar by timestamp, with no interpretation at the content level. Whether a given headline is bullish or bearish, whether it will move the market at all, is left entirely to the human to judge.
Second, keyword filtering is itself a fairly crude approach. Matching a keyword doesn't mean the news is actually important, and missing one doesn't mean it isn't — a person's own knowledge, experience, even their state of mind that day, can carry a lot of weight here. The same headline, with different people staring at the same chart, can lead to completely different conclusions.
Third, the whole flow is still "human-in-the-loop," and response speed is limited by human reaction time — yet much of the time the market reacts to news on a minute-by-minute or even second-by-second scale.
If there's interest in this direction, we'll later try building an LLM-based automated version, letting a model do the preliminary interpretation and importance-ranking of news, as an aid to — or even a replacement for — manual decision-making. If that sounds interesting to you, stay tuned.
Strategy code: Real-Time News FUSE System
- 1