
17
关注
35
关注者
按highstock官例写了个测试
直接图形都没出来了 围观
var ObjChart = null
var preBarTime = 0
var chart = {
__isStock: true,
extension: {
layout: 'single', // 不参于分组,单独显示, 默认为分组 'group'
height: 600, // 指定高度 // 指定宽度占的单元值, 总值 为12
},
plotOptions: {
candlestick: {
color: '#d75442',
upColor: '#6ba583'
}
},
rangeSelector: {
buttons: [{
type: 'hour',
count: 1,
text: '1h'
}, {
type: 'hour',
count: 3,
text: '3h'
}, {
type: 'hour',
count: 8,
text: '8h'
}, {
type: 'all',
text: 'All'
}],
selected: 2,
inputEnabled: true
},
legend: {
enabled: true,
},
tooltip: {xDateFormat: '%Y-%m-%d %H:%M:%S, %A'}, // 缩放工具
title : { text : '双坐标折线'}, // 标题
rangeSelector: { // 选择范围
buttons: [{type: 'hour',count: 1, text: '1h'}, {type: 'hour',count: 3, text: '3h'}, {type: 'hour', count: 8, text: '8h'}, {type: 'all',text: 'All'}],
selected: 3,
inputEnabled: true
},
xAxis: { type: 'datetime'}, // 坐标轴横轴 即:x轴, 当前设置的类型是 :时间
yAxis : [{ // Primary yAxis // 坐标轴纵轴 即:y轴, 默认数值随数据大小调整。
labels: {
format: '{value}',
},
title: {
text: 'BTC/USDT',
},
showInLegend: true,
opposite: false
}],
series: [{
type: 'candlestick',
name: 'BTC',
id: 'btc',
zIndex: 2,
data: []
}, {
type: 'column',
name: 'Volume',
id: 'volume',
data: [],
yAxis: 1
}, {
type: 'vbp',
linkedTo: 'btc',
params: {
volumeSeriesID: 'volume'
},
dataLabels: {
enabled: false
},
zoneLines: {
enabled: false
}
}
]
};
function main() {
ObjChart = Chart(chart)
ObjChart.reset();
LogReset()
LogVacuum()
while(1){
var records = exchange.GetRecords()
if(records == null || typeof(records) === 'undefined' || records.length == 0) {
} else {
for(var index = 0; index < records.length; index++) {
if(records[i].Time > preBarTime){
ObjChart.add(0, [records[i].Time, records[i].Open, records[i].High, records[i].Low, records[i].Close])
ObjChart.add(1, [records[i].Time, records[i].Volume])
}
}
if(typeof(records[records.length - 1].Time) !== 'undefined') {
preBarTime = records[records.length - 1].Time
}
}
Sleep(1000 * 60)
}
}
相关推荐
评论
全部评论 (10)

测试了
删除 series 里面的
            {
						type: 'column',
						name: 'Volume',
						id: 'volume',
						data: [],
						yAxis: 1
				}
就可以显示出来了, highstock 这个库,没有量柱吧。
7 年前
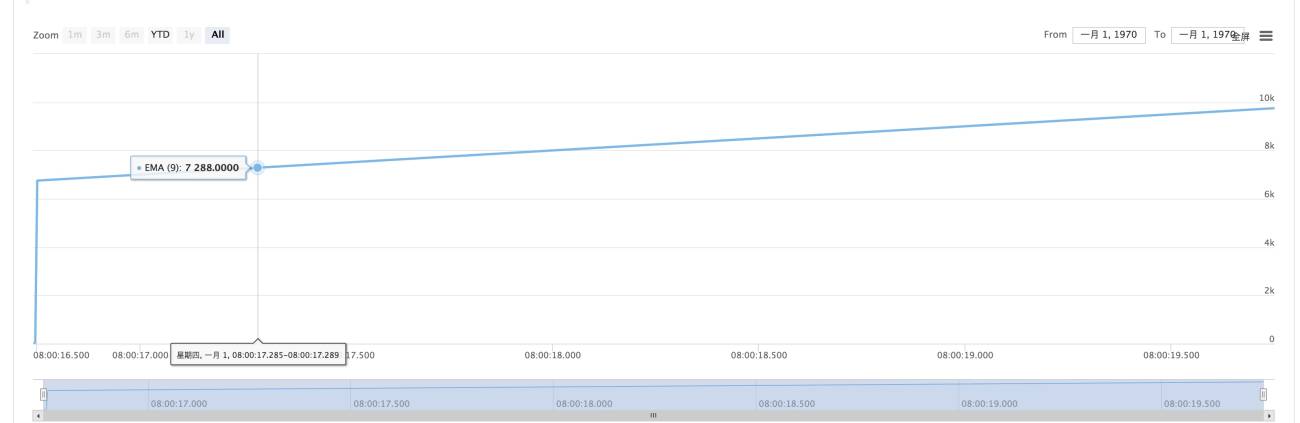
给您写了个范例,您看有帮助没:
            var chart = {
    __isStock: true,
    plotOptions: {
        series: {
            // general options for all series
        },
        ema: {
            // shared options for all ema series
        }
    },
    xAxis: { type: 'datetime'},
    series : [
        {type: 'ema', data : [1,2,3,4,5,6,7,8,8]},
    ]
};

function main() {
    var obj = Chart(chart)
    obj.reset()
    var i = 10000
    var j = 1
    while(1) {
        obj.add(0, [i++, j++]);
        Sleep(1000)
    }
}
7 年前
- 1