

As a matter of fact, before making this example code, there is already a JavaScript version of the MACD indicator drawing example on the strategy square of FMZ Quant Trading Platform: https://www.fmz.com/strategy/151972. However, according to the user's needs, we still write an example of Python version, which can be used as reference code in the strategy development design drawing.
The code is very simple:
'''backtest
start: 2020-01-28 00:00:00
end: 2020-02-26 00:00:00
period: 1d
exchanges: [{"eid":"OKEX","currency":"BTC_USDT"}]
'''
ChartCfg = {
'__isStock': True,
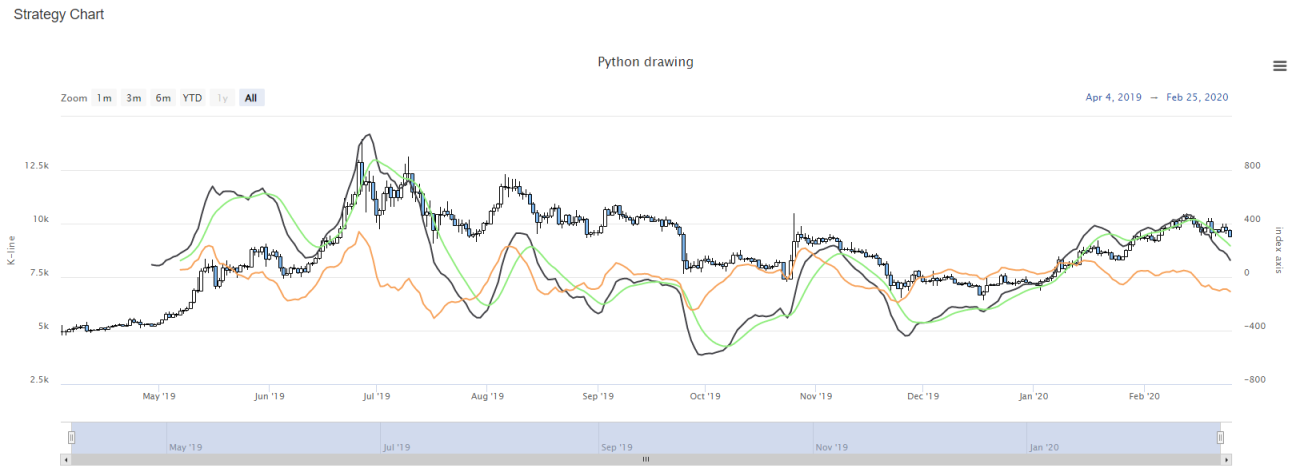
'title': {
'text': 'Python drawing'
},
'yAxis': [{
'title': {'text': 'K-line'},
'style': {'color': '#4572A7'},
'opposite': False
}, {
'title': {'text': 'index axis'},
'opposite': True
}],
'series': [{
'type': 'candlestick',
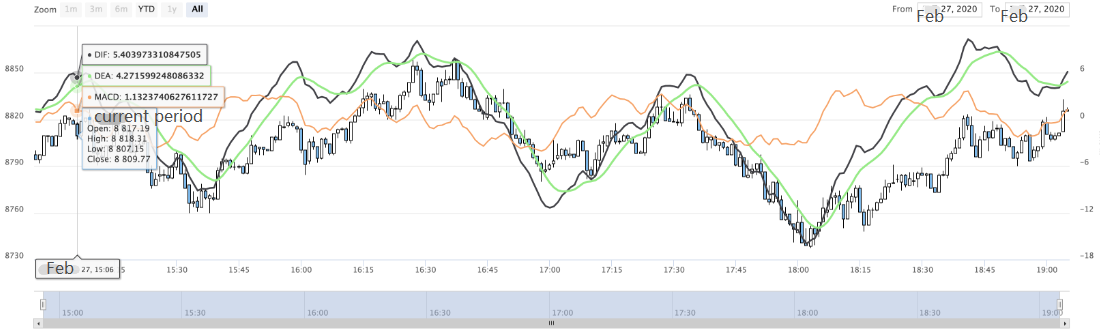
'name': 'current period',
'id': 'primary',
'data': []
}, {
'type': 'line',
'id': 'dif',
'name': 'DIF',
"yAxis" : 1,
'data': []
}, {
'type': 'line',
'id': 'dea',
'name': 'DEA',
"yAxis" : 1,
'data': []
}, {
'type': 'line',
'id': 'macd',
'name': 'MACD',
"yAxis" : 1,
'data': []
}]
}
def main():
global ChartCfg
preTime = 0
chart = Chart(ChartCfg)
chart.reset()
while True:
while True:
r = _C(exchange.GetRecords)
if len(r) > 50:
break
# calculate the indicator
macd = TA.MACD(r)
LogStatus(_D(), len(r))
# drawing
for i in range(len(r)):
if r[i]["Time"] == preTime:
chart.add(0, [r[i]["Time"], r[i]["Open"], r[i]["High"], r[i]["Low"], r[i]["Close"]], -1)
chart.add(1, [r[i]["Time"], macd[0][i]], -1)
chart.add(2, [r[i]["Time"], macd[1][i]], -1)
chart.add(3, [r[i]["Time"], macd[2][i]], -1)
elif r[i]["Time"] > preTime:
chart.add(0, [r[i]["Time"], r[i]["Open"], r[i]["High"], r[i]["Low"], r[i]["Close"]])
chart.add(1, [r[i]["Time"], macd[0][i]])
chart.add(2, [r[i]["Time"], macd[1][i]])
chart.add(3, [r[i]["Time"], macd[2][i]])
preTime = r[i]["Time"]
Sleep(500)
ChartCfg chart configuration dictionary
The ChartCfg dictionary variable stores chart configuration information, such as:
How many lines are there in this chart? (Three indicator lines, DIF, DEA and MACD respectively)
Is there a K-line in the chart? ('type': 'candlestick' refers to the type set as K-line data)
MACD values are relatively small. If the trading pair is BTC_USDT, when drawing, the indicators will be compressed together, which is very inconvenient to see, so the chart should also be configured as two Y axes. (Therefore, there are two Y-axis configurations in 'yAxis', one is the indicator axis and the other is the K-line axis)
Load data
In this example strategy, the main function starts to initialize the chart, it calls the Chart function, and passes the chart configuration ChartCfg as a parameter to generate a chart object. Then it enters into a loop, obtain K-line data constantly, judge that the number of BAR in K-line data is more than 50, and then calculate MACD indicators (too few BAR can not calculate effective indicators). Then we can write the K-line data and indicator data into the chart.
We write it in the chart by using the add function of the chart object.
When writing, if the last parameter -1 of the add function is specified, it is the value to update the current data point. If -1 is not transferred, a new data point is added.
When the K-line BAR is newly generated, a new data point is added. When the K-line BAR is not generated, the last BAR and the corresponding indicator are updated. (Determined by comparing the timestamps of K-line BAR)
It can be backtested directly
It can also run on a real bot:
Strategy example address:
https://www.fmz.com/strategy/187379
If you have any questions, please leave a message. Thank you~
- 1