

Practice and application of thermostat strategy on FMZ Quant platform
Why is it called a thermostat? We named the system according to its adaptability to shift and trade in both market volatility and trending patterns. This system is derived from our observation of the success of specific systems in specific market areas. The system can create strategies with a dual nature to make full use of both patterns of the market.
First, we create a function to help determine the market pattern. According to the output of this function, the thermostat switches from follow mode to short-term swing mode.
The trend tracking mode is similar to the trend tracking mechanism in the Bollinger bands. The short-term swing system is an open breakthrough including pattern recognition. The function compares the wandering distance of the market with the actual distance of the market:
Abs (closing price - closing price[29])/(highest price(30) - lowest price (low price, 30 days) * 100
The function generates values between 0 and 100. The higher the value is, the less crowded the current market will be. If the value returned by the function is less than 20, the system enters the short-term swing mode.
Basically, most of the market is showing a swing movement, and the system tries to catch the fluctuation and get a small profit from it. The thermostat tries to achieve this feat by buying/selling small market impulse. If the fluctuation is large enough, the system will switch modes.
Through in-depth analysis of short-term fluctuations, we find that sometimes buying is better than selling, and vice versa. At this time, it can be determined by simple visual mode. If today's closing price is higher than yesterday's high point, low point and closing price (also known as the key point of the day), we think that tomorrow's market action may be bearish. However, if today's closing price is lower than yesterday's high point, low point and average closing price, then today's market may be bullish. We classify these times as prices that are easier to buy and sell.
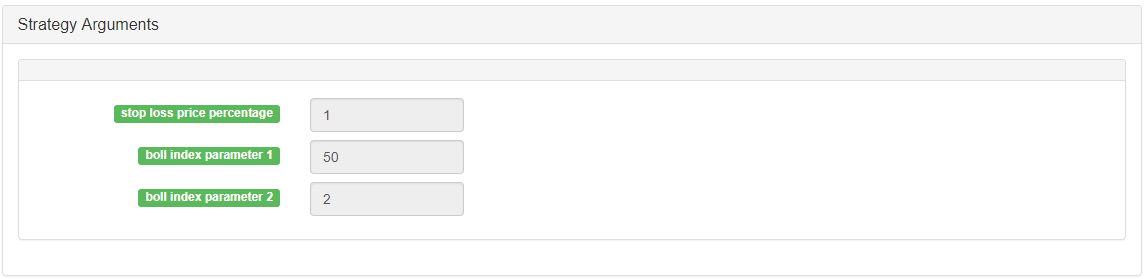
On the FMZ Quant platform, the thermostat strategy is a very popular strategy. Users can add some additional trading logic according to their own needs to make the strategy perform better. The following is a typical framework of the thermostat strategy on the FMZ Quant platform:
-
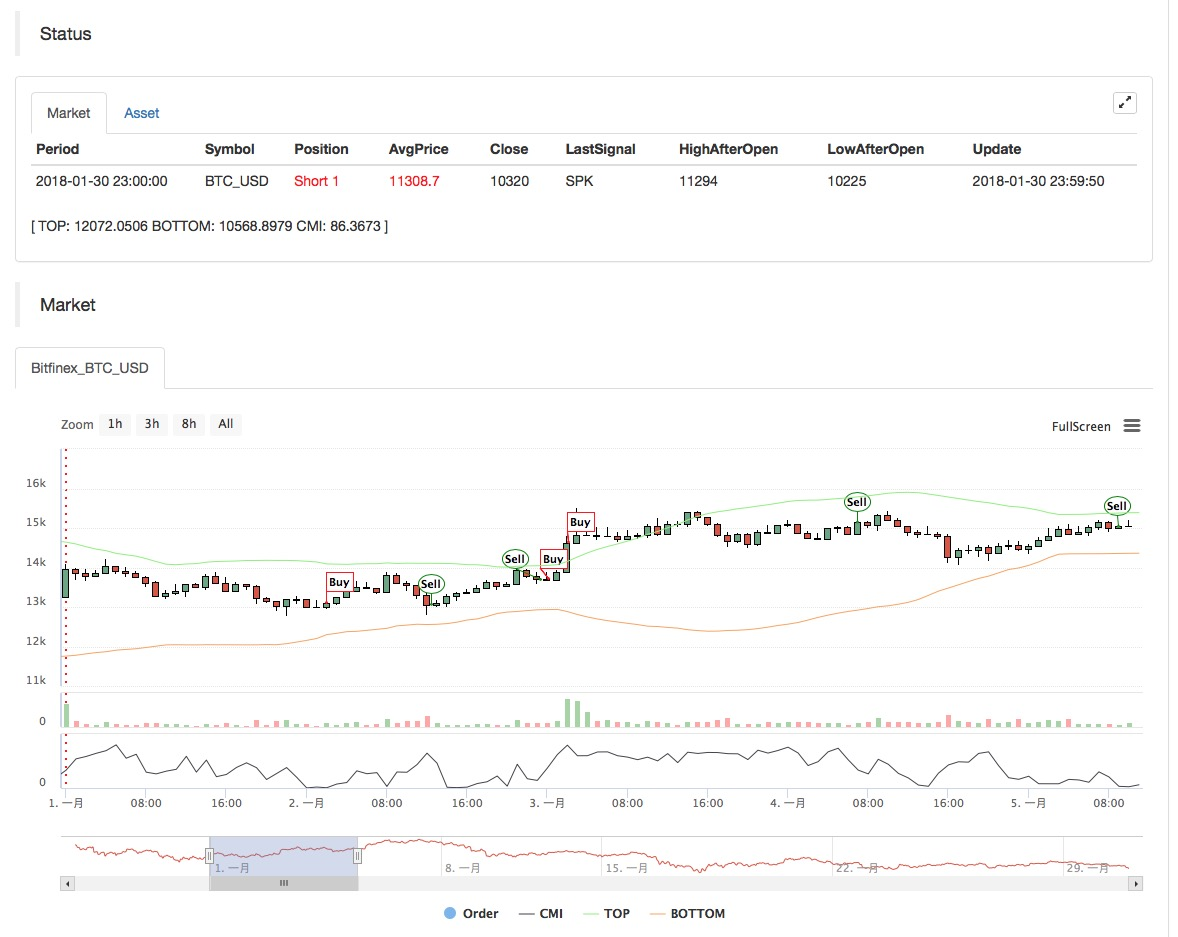
Main chart:
Upper track formula: TOP^^MAC+N_TMPTMP;// Bollinger channel upper track
Down track formula: BOTTOM^^MAC-N_TMPTMP;// Bollinger channel down track -
Subchart:
CMI formula: CMI:ABS(C-REF(C,N_CMI-1))/(HHV(H,N_CMI)-LLV(L,N_CMI))*100;//The greater the value of 0-100 is, the stronger the trend will be. CMI < 20 is volatility mode, CMI >20 is the trend. -
Code (MyLanguage):
MAC:=MA(CLOSE,N);
TMP:=STD(CLOSE,N);
TOP^^MAC+N_TMP*TMP; // Bollinger channel upper track
BOTTOM^^MAC-N_TMP*TMP; // Bollinger channel down track
BBOLL:=C>MAC;
SBOLL:=C<MAC;
N_CMI:=30;
CMI:ABS(C-REF(C,N_CMI-1))/(HHV(H,N_CMI)-LLV(L,N_CMI))*100; // The greater the value of 0-100 is, the stronger the trend will be. CMI < 20 is volatility mode, CMI >20 is the trend.
N_KD:=9;
M1:=3;
M2:=3;
RSV:=(CLOSE-LLV(LOW,N_KD))/(HHV(HIGH,N_KD)-LLV(LOW,N_KD))*100; // The difference between the closing price and the lowest value of N period is made, the difference between the highest value of N period and the lowest value of N period is made, and the ratio between the two differences is made.
K:=SMA(RSV,M1,1); // Moving average of RSV
D:=SMA(K,M2,1); // Moving average of K
MIND:=30;
BKD:=K>D AND D<MIND;
SKD:=K<D AND D>100-MIND;
// Oscillation mode
BUYPK1:=CMI < 20 AND BKD; // Oscillating long position, buy close
SELLPK1:=CMI < 20 AND SKD; // Oscillating short position, sell close
// Handling of original oscillating positions in trend mode
SELLY1:=REF(CMI,BARSBK) < 20 AND C>BKPRICE*(1+0.01*STOPLOSS*3) AND K<D; // Oscillation long position stop-profit
BUYY1:=REF(CMI,BARSSK) < 20 AND C<SKPRICE*(1-0.01*STOPLOSS*3) AND K>D; // Oscillation short position stop-profit
// Trend mode
BUYPK2:=CMI >= 20 AND C > TOP; // Trend long position, buy close
SELLPK2:=CMI >= 20 AND C < BOTTOM; // Trend short position, sell close
// Handling of original oscillating positions in trend mode
SELLY2:=REF(CMI,BARSBK) >= 20 AND C>BKPRICE*(1+0.01*STOPLOSS*3) AND SBOLL;// Trend long position stop-profit
BUYY2:=REF(CMI,BARSSK) >= 20 AND C<SKPRICE*(1-0.01*STOPLOSS*3) AND BBOLL;// Trend short position stop-profit
SELLS2:=REF(CMI,BARSBK) >= 20 AND C<BKPRICE*(1-0.01*STOPLOSS) AND SBOLL;// Trend long position stop-loss
BUYS2:=REF(CMI,BARSSK) >= 20 AND C>SKPRICE*(1+0.01*STOPLOSS) AND BBOLL;// Trend short position stop-loss
IF BARPOS>N THEN BEGIN
BUYPK1,BPK;
SELLPK1,SPK;
BUYPK2,BPK;
SELLPK2,SPK;
END
BUYY1,BP(SKVOL);
BUYY2,BP(SKVOL);
BUYS2,BP(SKVOL);
SELLY1,SP(BKVOL);
SELLY2,SP(BKVOL);
SELLS2,SP(BKVOL);
The results of the strategy backtest are as follows:
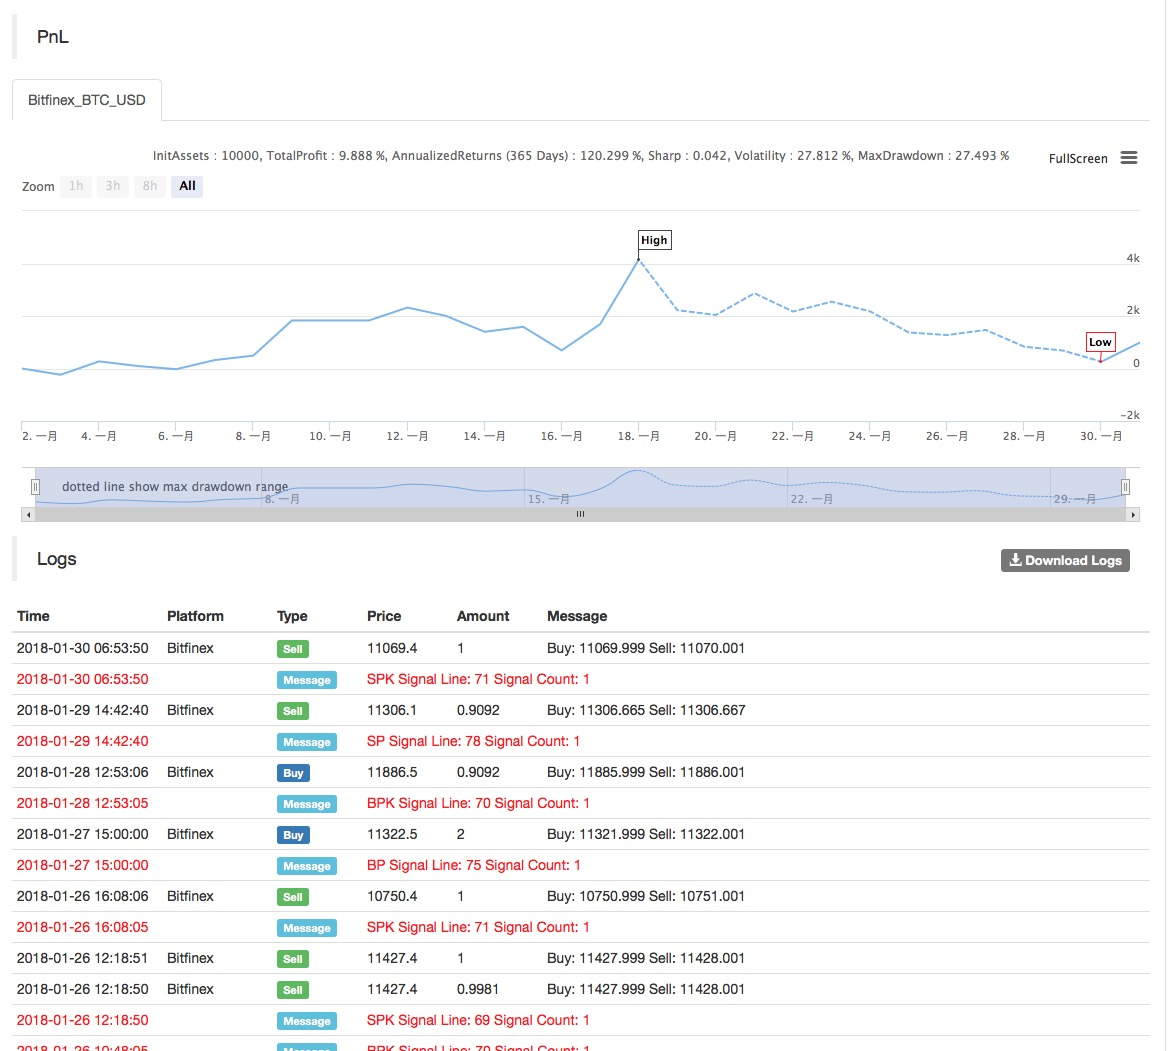
For more information, please refer to: https://www.fmz.com/strategy/129086.
- 1