সুপার ট্রেন্ড ভি কৌশল

ওভারভিউ
সুপার ট্রেন্ড ভি কৌশলটি একটি সংক্ষিপ্ত ট্রেডিং কৌশল যা চলমান গড় এবং স্ট্যান্ডার্ড ডিফারেনশিয়ালের উপর ভিত্তি করে। এটি চলমান গড়ের সাথে সংযুক্ত সমর্থন এবং প্রতিরোধের সাথে দামের প্রবণতার দিকনির্দেশনা নির্ধারণের জন্য সুপার ট্রেন্ড সূচকটি ব্যবহার করে। একই সাথে, এটি স্ট্যান্ডার্ড ডিফারেনশিয়াল চ্যানেল ব্যবহার করে দামের সম্ভাব্য সমর্থন এবং প্রতিরোধের অঞ্চলগুলির পূর্বাভাস দেওয়ার জন্য, স্টপ লস স্টপ দামের অঞ্চলগুলি সেট করে, প্রবণতা অনুসরণ এবং দক্ষতার সাথে প্রস্থান করার জন্য সংক্ষিপ্ত ট্রেডিং কৌশল।
কৌশল নীতি
এই কৌশলটি প্রথমে সুপার ট্রেন্ড সূচকটি গণনা করে, যা ট্রেন্ডের দিকনির্দেশনা করার জন্য এটিআর এবং দামের সম্পর্কের ব্যবহার করে। দামগুলি যখন উত্থানের প্রবণতার উপরে থাকে তখন এটি মুদ্রাস্ফীতি হয় এবং দামগুলি যখন পতনের প্রবণতার নীচে থাকে তখন এটি মুদ্রাস্ফীতি।
এরপরে দামের চলমান গড় ইএমএ এবং ওপেনিং দামের চলমান গড় ইএমএ গণনা করা হয়, যখন দাম চলমান গড়ের উপরে এবং ওপেনিং গড়ের উপরে থাকে তখন এটি কেনার সংকেত দেয় এবং যখন দাম চলমান গড়ের নীচে এবং ওপেনিং গড়ের নীচে থাকে তখন এটি বিক্রি করার সংকেত দেয়।
তারপরে, স্ট্যান্ডার্ড বিভাজক ব্যবহার করে মূল্যের চ্যানেলের উত্থান-পতন গণনা করুন এবং এটি মসৃণভাবে পরিচালনা করুন, দামটি স্ট্যান্ডার্ড বিভাজক অতিক্রম করলে স্টপ সিগন্যালটি বন্ধ হয়ে যায় এবং দামটি স্ট্যান্ডার্ড বিভাজক অতিক্রম করলে স্টপ সিগন্যালটি বন্ধ হয়ে যায়।
পরিশেষে, সুপার ট্রেন্ড সূচকের সাথে মিলিত বিভিন্ন সময়কালের মুভিং এভারেজগুলি ট্রেন্ডের দিকনির্দেশের জন্য ব্যবহৃত হয়, যা স্থিতিশীল ট্রেন্ডের বিচার করে।
কৌশলগত সুবিধা
- সুপার ট্রেন্ড সূচকগুলি ব্যবহার করে মূল্যের প্রবণতার দিকনির্দেশনা নির্ধারণ করুন, প্রবণতা বিপরীত হওয়ার ফলে ক্ষতি এড়াতে
- মুভিং এভারেজ এবং ওপেন প্রাইস এন্ট্রি সময় নির্ধারণে সাহায্য করে এবং মিথ্যা ব্রেকডাউন এড়ায়
- স্ট্যান্ডার্ড ডিফারেনশিয়াল চ্যানেল সম্ভাব্য সমর্থন এবং প্রতিরোধের অঞ্চলগুলির পূর্বাভাস দেয় এবং স্টপ-ড্রপ মূল্য নির্ধারণ করে
- একাধিক সময়কালের সাথে প্রবণতার দিকনির্দেশনা এবং স্থিতিশীলতা
কৌশলগত ঝুঁকি
- সুপার ট্রেন্ডের সূচকগুলি পিছিয়ে আছে, ট্রেন্ডের পরিবর্তনগুলি বাদ দিতে পারে
- চলমান গড়ের ক্রস-সিগন্যাল বিলম্বিত হয়, সময়মতো প্রবেশ করা যায় না
- স্ট্যান্ডার্ড ডিফেন্ডার চ্যানেলের পরিসীমা খুব স্থির, যা বাজারের অস্থিরতাকে বাস্তব সময়ে প্রতিফলিত করে না
- একাধিক সময়কালের বিচার একটি অপরটির সাথে দ্বন্দ্ব সৃষ্টি করতে পারে
ঝুঁকি মোকাবিলার উপায়ঃ
- সুপার ট্রেন্ড প্যারামিটারগুলি যথাযথভাবে সংক্ষিপ্ত করুন এবং সংবেদনশীলতা বাড়ান
- চলমান গড় চক্রের অপ্টিমাইজেশান, বা অন্যান্য সূচক যোগ করা
- স্ট্যান্ডার্ড ডিফারেনশিয়াল চ্যানেল প্যারামিটারগুলিকে গতিশীলভাবে সামঞ্জস্য করে যাতে পরিসীমাটি বাজারের সাথে সামঞ্জস্যপূর্ণ হয়
- সম্ভাব্য দ্বন্দ্ব মোকাবেলার জন্য বহু-চক্রের বিচারের লজিক নির্ধারণ করুন
কৌশল অপ্টিমাইজেশনের দিকনির্দেশনা
- সুপার ট্রেন্ড প্যারামিটার অপ্টিমাইজ করুন, সর্বোত্তম প্যারামিটার সমন্বয় খুঁজুন
- অন্য সূচকগুলি ব্যবহার করে দেখুন এবং চলমান গড়ের সাথে মিলিত হয়ে দেখুন
- স্ট্যান্ডার্ড ডিফারেনশিয়াল চ্যানেল প্যারামিটারগুলিকে গতিশীলভাবে সামঞ্জস্য করার চেষ্টা করুন
- বিভিন্ন বহু-চক্রের সমন্বয় পরীক্ষা করে সবচেয়ে উপযুক্ত চক্র খুঁজে বের করা
- স্টপ লস স্টপ কৌশলকে অপ্টিমাইজ করুন যাতে আপনার কৌশলটি লাভের সুযোগ পায়
সারসংক্ষেপ
সুপারট্রেন্ড ভি কৌশলটি প্রবণতা, গড় লাইন এবং স্ট্যান্ডার্ড ডিফারেনশিয়াল চ্যানেলের মতো সূচকগুলির সুবিধাগুলিকে একীভূত করে, প্রবণতার দিকনির্দেশের স্থিতিশীল বিচার করে, উপযুক্ত প্রবেশের সময়টি চয়ন করে এবং দামের অঞ্চলে স্টপ-ড্রপ স্টপিংয়ের সংক্ষিপ্ত ট্রেডিং কৌশল সেট করে। প্যারামিটার অপ্টিমাইজেশন, সূচক অপ্টিমাইজেশন, স্টপ-ড্রপ অপ্টিমাইজেশনের মাধ্যমে উন্নতি করা, কৌশল স্থিতিশীলতা এবং লাভজনকতা বাড়িয়ে তুলতে পারে। এর দৃ logical় যুক্তি এবং কঠোর চিন্তাভাবনা শেখার এবং অধ্যয়নের জন্য উপযুক্ত।
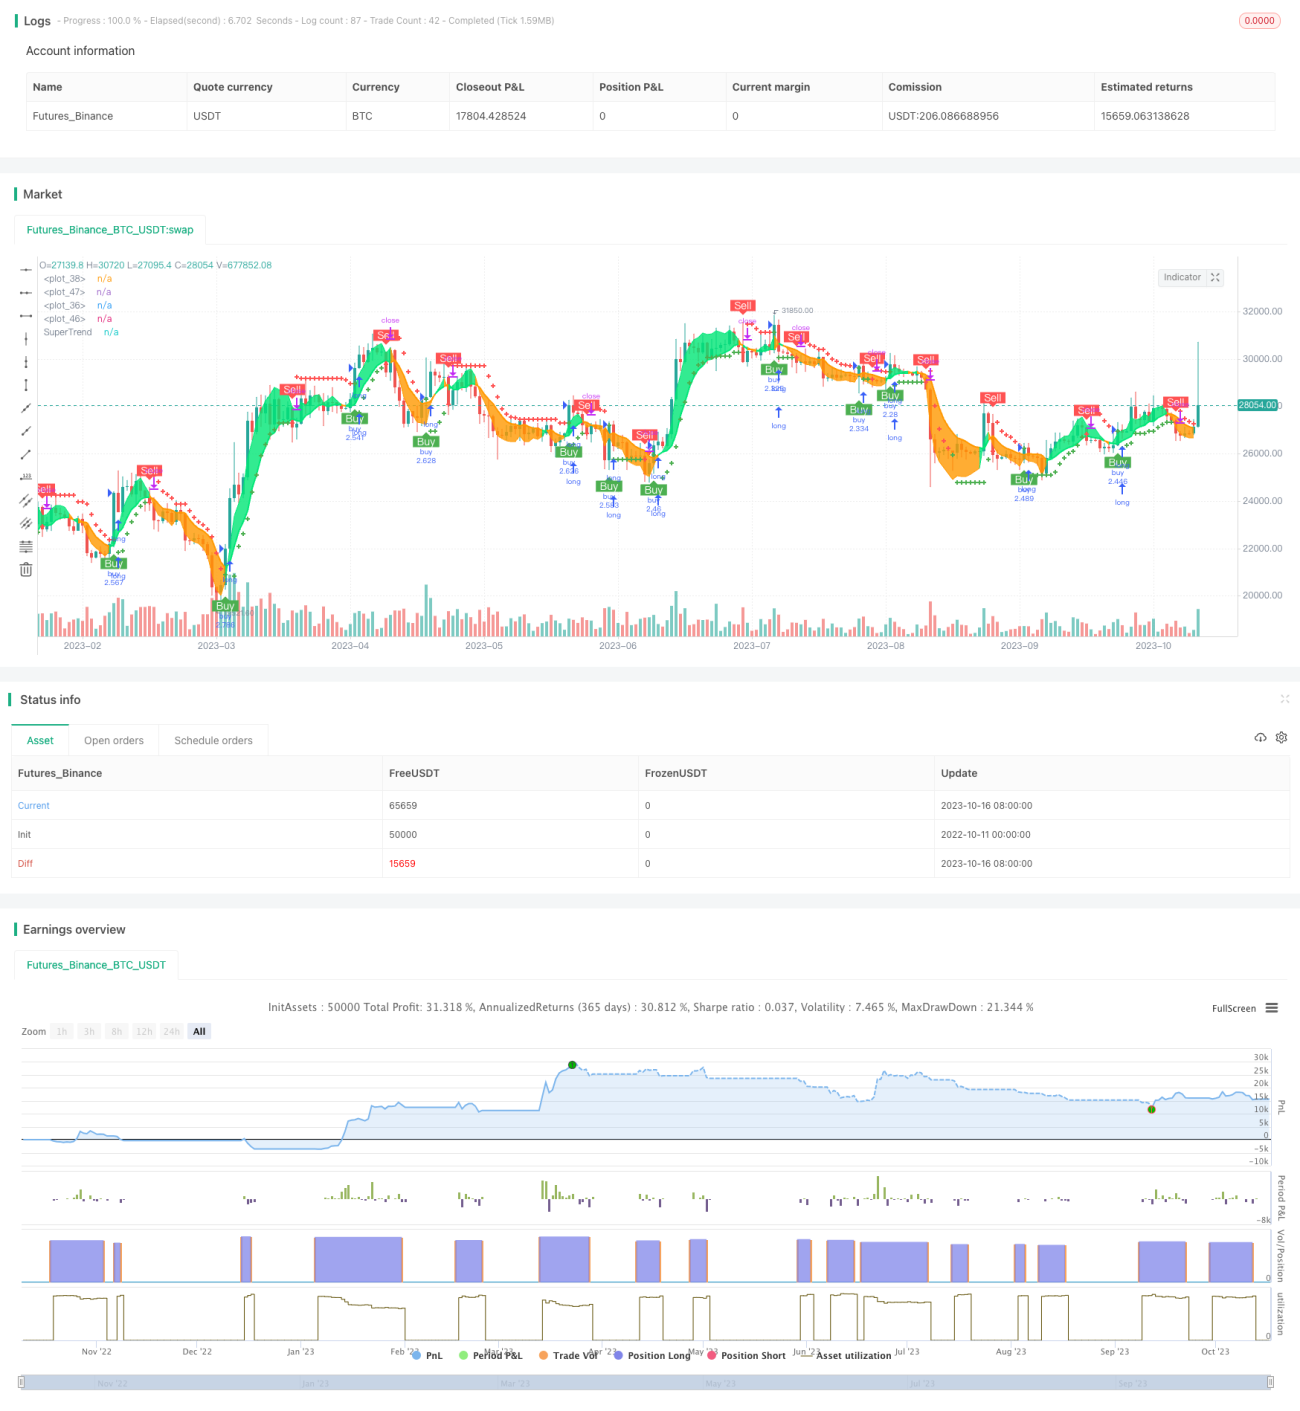
/*backtest
start: 2022-10-11 00:00:00
end: 2023-10-17 00:00:00
period: 1d
basePeriod: 1h
exchanges: [{"eid":"Futures_Binance","currency":"BTC_USDT"}]
*/

// © theCrypster 2020

//@version=4
strategy(title = "Super trend V Strategy version", overlay = true, pyramiding=1,initial_capital = 1000, default_qty_type= strategy.percent_of_equity, default_qty_value = 100, calc_on_order_fills=false, slippage=0,commission_type=strategy.commission.percent,commission_value=0.075)- 1