মাসিক ট্রেন্ড ব্রেকআউট কৌশল

ওভারভিউ
মাসিক ট্রেন্ড ব্রেকিং কৌশল হল একটি পিন স্ক্রিপ্ট ভিত্তিক ট্রেডিংভিউ সূচক। এই কৌশলটি স্বনির্ধারিত মুভিং এভারেজ, ট্রেন্ড লাইন ব্রেকিং এবং আরএসআই সূচকগুলির সমন্বয় ব্যবহার করে প্রতি মাসে কেবলমাত্র একবারের জন্য মাল্টিপ্লেয়ার প্রবেশের সময় নির্ধারণ করে। যখন আরএসআই সূচকটি ওভারবোর দেখায়, তখন পজিশনটি বের হয়ে যায়।
কৌশল নীতি
-
lastEntryMonth রেকর্ডের শেষ মাসে একটি ভেরিয়েবল সংজ্ঞায়িত করুন। currentMonth বর্তমান মাস পায়।
-
TRAMA-কে চলমান গড়ের length=৯৯ প্যারামিটার অনুযায়ী সেট করুন, যাতে আপনি মূল্যকে মসৃণ করতে পারেন এবং ট্রেন্ডের দিকনির্দেশনা বুঝতে পারেন।
-
length_trend=14 প্যারামিটার সেট করুন, এবং একটি উচ্চ পয়েন্টের ট্রেন্ড লাইন আপার আঁকুন। যখন দাম ট্রেন্ড লাইন অতিক্রম করে তখন এটি একটি ব্রেকিং হিসাবে বিচার করা হয়।
-
আরএসআই সূচক প্যারামিটার rsiLength = 14 গণনা করে, ওভারবয় ওভারসোল্ড নির্ধারণ করে।
-
এন্ট্রি লজিকঃ যখন বন্ধের মূল্য ট্রামার চেয়ে বেশি হয় এবং বন্ধের মূল্য ট্র্যাকের বাইরে চলে যায়, যদি গত মাসে প্রবেশ না করা হয় তবে আরও প্রবেশ করুন।
-
প্রস্থান লজিকঃ যখন RSI 70 এর চেয়ে বড় হয়, সমতল স্থিতি।
-
ট্রামা কার্ভ, আরএসআই এর ওভারবয় লাইন আঁকুন এবং কৌশলটি সম্পূর্ণ করুন।
এই কৌশলটি তিনটি প্রধান প্রযুক্তিগত সূচককে একত্রিত করে, ট্রেন্ড, মোমেন্টাম এবং ওভারবয় ওভারসেলের বিষয়ে বিচার করে, প্রতি মাসে একবারের কম ঝুঁকি নিয়ে আরও বেশি সুযোগ খুঁজতে। একই সাথে, কেবলমাত্র দামের উত্তোলনের প্রবণতা অতিক্রম করার জন্য সীমাবদ্ধতা প্রবেশ করুন, সমন্বয় অঞ্চলে অকার্যকর অপারেশন এড়াতে।
সামর্থ্য বিশ্লেষণ
-
বিভিন্ন সূচকের সমন্বয়, বাজার পরিস্থিতির সমন্বিত বিচার, সিদ্ধান্ত গ্রহণের সঠিকতা বৃদ্ধি।
-
শুধু মাসিক সময় ফ্রেমব্রেক করার সময় প্রবেশ করুন, ঘন ঘন লেনদেন এড়িয়ে চলুন।
-
এই প্রবণতাটি একটি স্বনির্ধারিত মুভিং এভারেজ দ্বারা নির্ধারণ করা হয়, যা দ্রুত পরিবর্তনের দিকে পরিচালিত করে।
-
ওভার-বই ইন্ডিকেটরের সাহায্যে বাজারের উচ্চতা এড়ানো এবং ঝুঁকি নিয়ন্ত্রণ করা।
-
সহজ, স্বজ্ঞাত এবং সহজেই বোঝা যায়।
-
এই প্যারামিটারগুলিকে আপনার প্রয়োজন অনুসারে সামঞ্জস্য করা যায়, যাতে আপনি আরও ভাল কৌশলগত অপ্টিমাইজেশান পেতে পারেন।
ঝুঁকি বিশ্লেষণ
-
বিপর্যয় বিপর্যয় বিপর্যয় বিপর্যয় বিপর্যয় বিপর্যয় বিপর্যয় বিপর্যয় বিপর্যয় বিপর্যয় বিপর্যয় বিপর্যয় বিপর্যয় বিপর্যয় বিপর্যয়
-
প্রবণতা বিরতির সময় ভাল নির্বাচন করা হয় না, তবে শীর্ষের কাছাকাছি একটি উচ্চ প্রবেশদ্বার নির্বাচন করা হয়।
-
সূচক প্যারামিটারগুলি ভুলভাবে সেট করা হয়েছে, যার ফলে সূচকটি একটি বিভ্রান্তিকর সংকেত দেয়।
-
শুধুমাত্র ব্রেকআউটগুলি সাম্প্রতিক বাজার অস্থিরতা প্রতিফলিত করে। অভিযোজিত স্টপ / পজিশন সাইজিং বিবেচনা করুন
-
Monitor risk/reward. Consider only trading pullbacks or adding other confirmation filters.
-
Validate indicators on multiple timeframes. Use higher timeframes to identify trend and lower for entry.
-
Backtest over different market conditions. Optimize parameters to match strategy to market type.
অপ্টিমাইজেশান দিক
-
ভলিউম, এমএ ট্রান্সফার ভলিউম ইন্ডিকেটর নিশ্চিতকরণ যুক্ত করুন, কম ভলিউম ভুয়া ব্রেকডাউন এড়াতে।
-
আরএসআই পজিশন ওভারবাই করার সময়, মুনাফার কিছু অংশ বন্ধ করে দেওয়া এবং পজিশন ধরে রাখা।
-
চলমান গড়ের প্যারামিটারগুলিকে অপ্টিমাইজ করুন, পরিবর্তনের সাথে খাপ খাইয়ে নিন এবং প্রবণতা রূপান্তরকে আরও ভালভাবে ট্র্যাক করুন।
-
ব্রেকিং পয়েন্টের আগে এবং পরে ব্রেকিং পয়েন্টের আগে এবং পরে ব্রেকিং পয়েন্টের আগে এবং পরে একটি ব্রেকিং পয়েন্টের আগে এবং পরে একটি ব্রেকিং পয়েন্ট তৈরি করুন।
-
আরও ফিল্টারিং শর্ত যুক্ত করুন, যেমন চ্যানেল সূচক, ওঠানামা সূচক ইত্যাদি, সিদ্ধান্ত গ্রহণের নির্ভুলতা বাড়ানোর জন্য।
-
ক্যাটাগরিতে প্রবেশের সময়, যখন দামগুলি নতুন সংযোজন প্রতিরোধের লাইনটি ভেঙে চলেছে, তখন পজিশন বাড়ানো যেতে পারে।
সারসংক্ষেপ
মাসিক ট্রেন্ড ব্রেকিং কৌশলটি প্রবণতা, শক্তি এবং সীমাবদ্ধতার মতো একাধিক কারণকে বিবেচনা করে। এটি প্রবণতার দিকনির্দেশনা নির্ধারণ করে এবং নিম্ন সময়ের ফ্রেমগুলির ব্রেকিং কার্যকর করার সাথে মিলিত হয়। একই সাথে, আরএসআই সূচকগুলি কার্যকরভাবে ট্রেডিং ঝুঁকি নিয়ন্ত্রণ করে। এই কৌশলটি প্রতি মাসে একবারে আরও ভাল করার সুযোগ খুঁজতে একটি সহজ লজিক ব্যবহার করে। এটি প্রবণতা ট্র্যাকিং এবং ঝুঁকি ব্যবস্থাপনার উপর গুরুত্ব দেয়। এটি প্যারামিটার অপ্টিমাইজেশনের মাধ্যমে বিভিন্ন বাজার পরিস্থিতিতে সামঞ্জস্য করতে পারে।
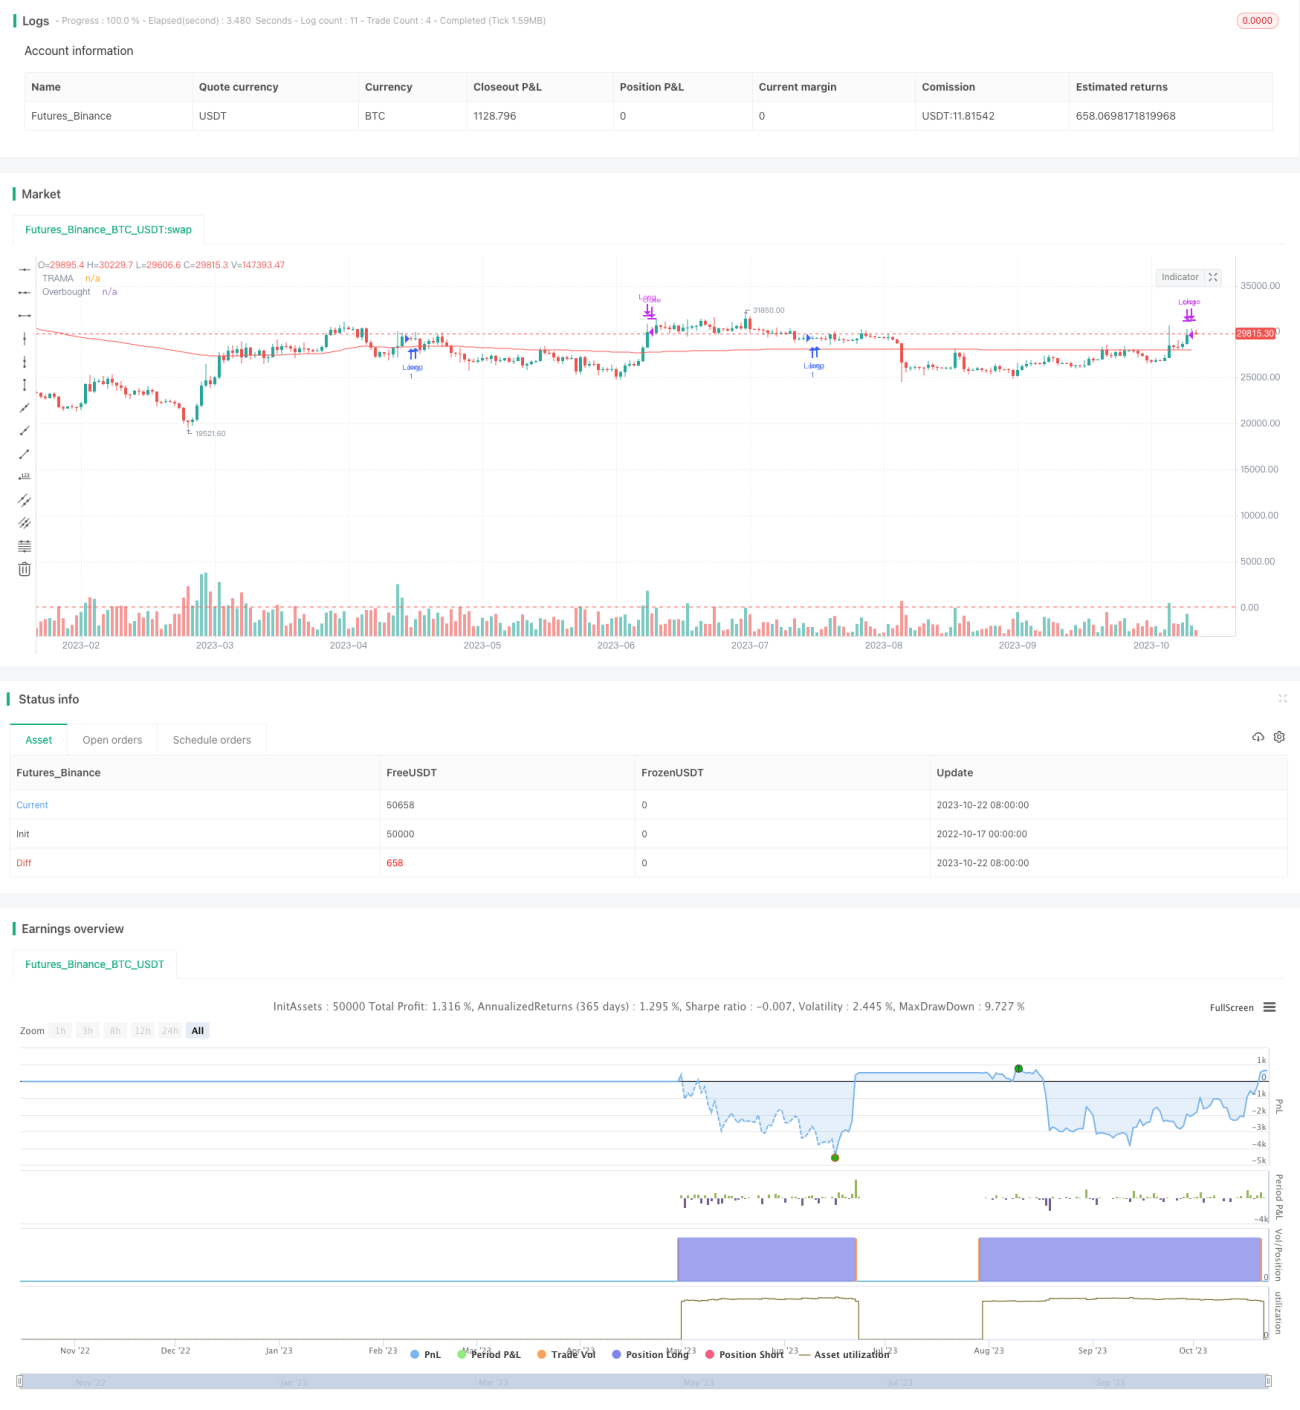
/*backtest
start: 2022-10-17 00:00:00
end: 2023-10-23 00:00:00
period: 1d
basePeriod: 1h
exchanges: [{"eid":"Futures_Binance","currency":"BTC_USDT"}]
*/

//@version=5
strategy('Bannos Strategy', shorttitle='Bannos', overlay=true)

//The provided script is an indicator for TradingView written in Pine Script version 5. The indicator is used to determine entry and exit points for a trading strategy. Here's a detailed breakdown of what the script does:- 1