বহুমাত্রিক সূচক সিদ্ধান্ত গ্রহণের উপর ভিত্তি করে স্বল্পমেয়াদী প্রবণতা কৌশল

ওভারভিউ
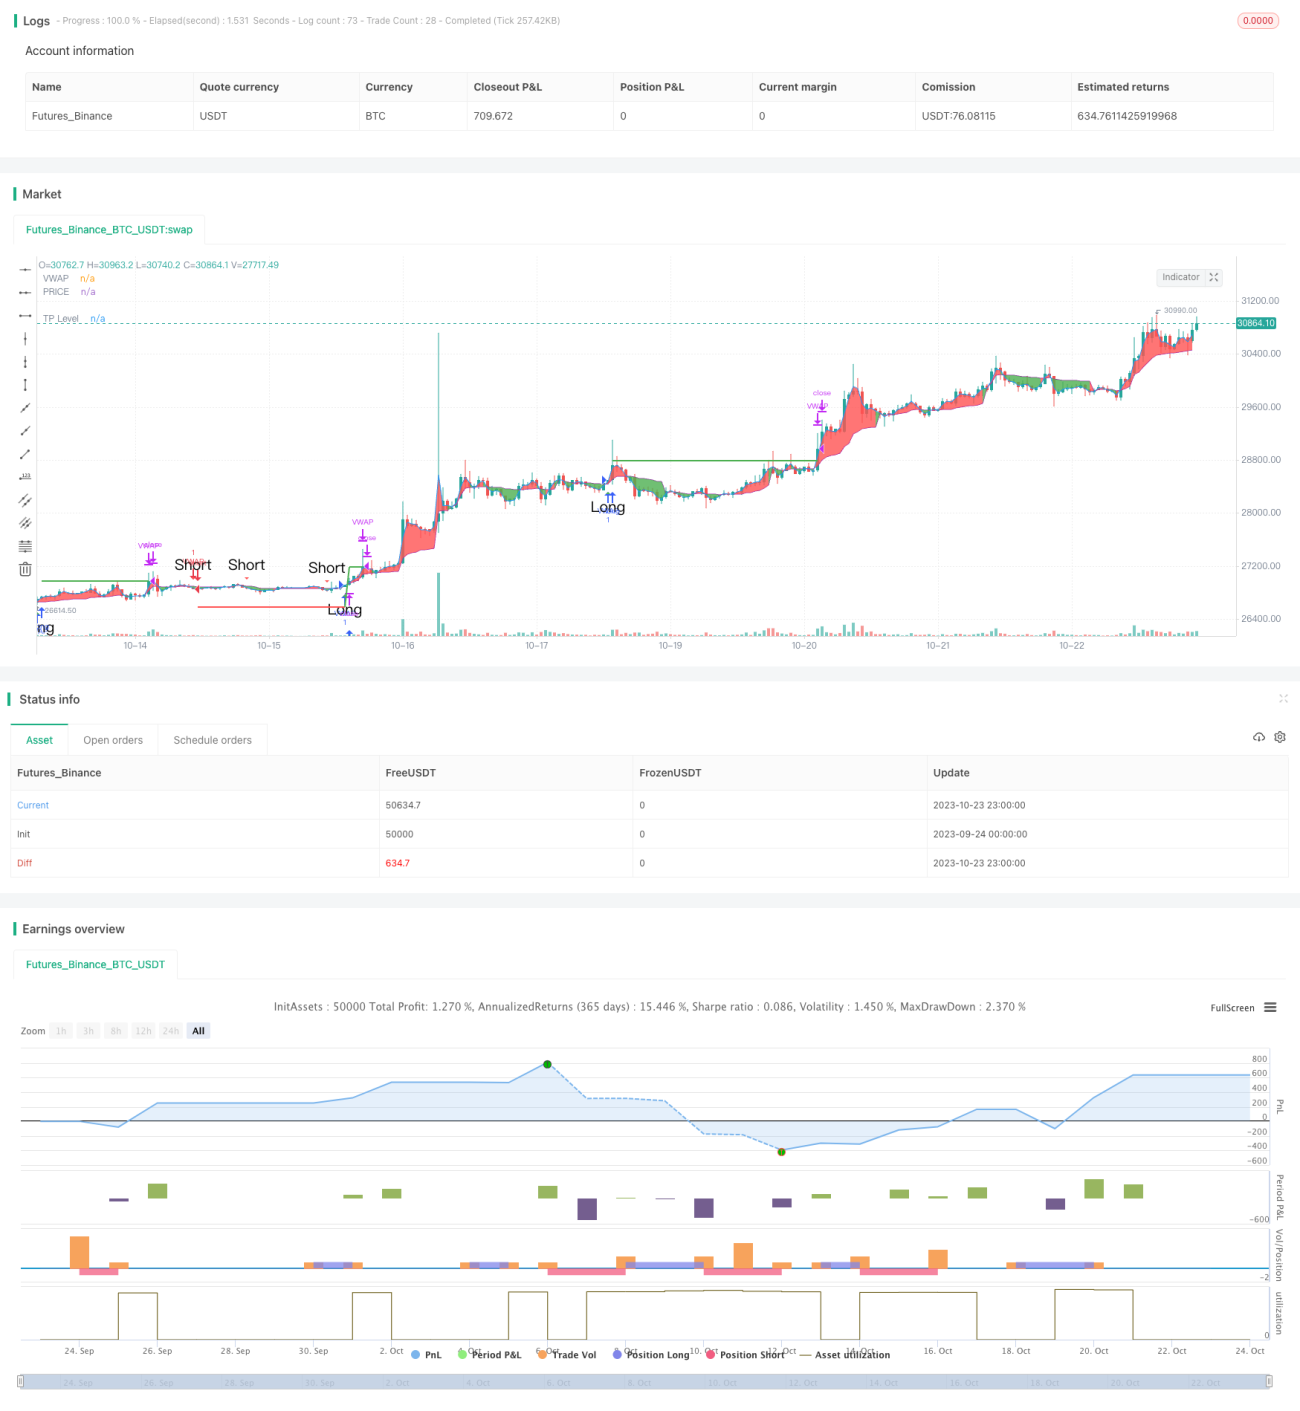
এই কৌশলটি তিনটি ভিন্ন মাত্রার প্রযুক্তিগত সূচককে একত্রিত করে, যেগুলি হল প্রতিরোধের স্তরকে সমর্থন করে, সমান্তরাল সিস্টেম এবং ওভার-বই ওভার-বিক্রয় সূচক, এবং তাদের সমন্বিত সংকেতের উপর ভিত্তি করে স্বল্পমেয়াদী প্রবণতার দিকনির্দেশনা নির্ধারণ করে, যাতে উচ্চতর বিজয়ী হার অর্জন করা যায়।
কৌশল নীতি
কোডটি প্রথমে দামের সমর্থন ও প্রতিরোধের অবস্থানগুলি গণনা করে, যার মধ্যে স্ট্যান্ডার্ড ওসিলেশন অক্ষ এবং ফিবোনাচি সমর্থন ও প্রতিরোধের অবস্থান রয়েছে, এবং এটি একটি চার্টে আঁকা হয়। যখন দামগুলি এই মূল স্থানগুলি অতিক্রম করে, তখন এটি একটি গুরুত্বপূর্ণ ট্রেন্ড সংকেত হিসাবে বিবেচিত হয়।
তারপর ওজনযুক্ত মুভিং এভারেজ ভিডাব্লুএপি এবং গড় মূল্য গণনা করা হয় এবং তাদের গোল্ডেন ক্রস এবং ডেডফোরক সিগন্যালের বিচার করা হয়। এটি মাঝারি এবং দীর্ঘমেয়াদী প্রবণতা বিচার।
শেষ অবধি, স্টোক্যাস্টিক আরএসআই সূচকটি গণনা করা হয়, এটির গোল্ড ক্রস এবং ডেডফোরক সংকেতগুলি বিচার করা হয়, যা ওভারব্লো ওভারসোল সূচকের অন্তর্গত।
এই তিনটি মাত্রার সমন্বিত সূচক, যদি সমর্থনকারী প্রতিরোধের স্তর, ভিডাব্লুএপি গড় লাইন এবং স্টোক্যাস্টিক আরএসআই একসাথে কেনার সংকেত দেয় তবে এটি একটি ওভারঅর্ডার খুলবে; যদি তিনজন একসাথে বিক্রয় সংকেত দেয় তবে এটি খালি থাকবে।
সামর্থ্য বিশ্লেষণ
এই কৌশলটির সবচেয়ে বড় সুবিধা হ'ল তিনটি ভিন্ন মাত্রার সূচকগুলিকে একত্রিত করা, যা বিচারকে আরও বিস্তৃতভাবে সঠিক করে তোলে এবং বিজয়ী হওয়ার সম্ভাবনা বেশি। প্রথমত, প্রতিরোধের স্তরটি মূল প্রবণতা নির্ধারণ করে; দ্বিতীয়ত, ভিডাব্লুএপি মধ্যম দীর্ঘ লাইন প্রবণতা নির্ধারণ করে; এবং শেষ পর্যন্ত, স্টোক্যাস্টিক আরএসআই ওভারবই ওভারসোলের সিদ্ধান্ত নেয়। তিনটি মাত্রার সূচক একই সাথে সংকেত প্রেরণ করে, যা ভুয়া সংকেতগুলিকে ফিল্টার করতে পারে এবং প্রবেশের সাফল্যের হারকে বাড়িয়ে তুলতে পারে।
এছাড়াও, কৌশলটি একটি স্টপ-অফ ফাংশন যুক্ত করেছে, যা তহবিল পরিচালনার জন্য অনুকূল, নির্দিষ্ট অনুপাতের আয়কে লক করতে পারে।
ঝুঁকি বিশ্লেষণ
এই কৌশলটির প্রধান ঝুঁকি হ'ল ডাব্লুডাব্লু সিদ্ধান্ত গ্রহণের উপর নির্ভর করে যে সূচকগুলি সিঙ্ক্রোনাইজড সংকেত দেয়, যদি কিছু সূচক ভুল সংকেত দেয় তবে সিদ্ধান্ত গ্রহণের ত্রুটি হতে পারে। উদাহরণস্বরূপ, স্টোক্যাস্টিক আরএসআই ওভারবাইট সংকেত দেয়, তবে ভিডাব্লুএপি এবং সমর্থন প্রতিরোধের বিচার এখনও বিজোড়, এই মুহুর্তে আপনি ক্রয় পয়েন্টটি মিস করতে পারেন এবং প্রবেশ করবেন না।
অন্যদিকে, সূচক প্যারামিটারগুলি ভুলভাবে সেট করাও সিগন্যাল বিচার ভুল হতে পারে। বারবার পুনরাবৃত্তির মাধ্যমে সর্বোত্তম প্যারামিটারগুলি খুঁজে বের করা প্রয়োজন।
উপরন্তু, স্টক মার্কেটে স্বল্পমেয়াদে প্রায়ই ব্ল্যাক সোয়ান ইভেন্ট দেখা দেয়, যার ফলে সূচকগুলি ব্যর্থ হয়। এই ঝুঁকি প্রতিরোধ করতে, স্টপ লস কৌশল অন্তর্ভুক্ত করা যেতে পারে, যাতে একক ক্ষতির পরিমাণ বেশি না হয়।
অপ্টিমাইজেশান দিক
এই কৌশলটি নিম্নলিখিত দিকগুলি থেকে আরও উন্নত করা যেতে পারেঃ
-
ট্রেন্ডের শক্তি ও দুর্বলতা নির্ণয় করতে এবং সিদ্ধান্ত গ্রহণের সঠিকতা বাড়ানোর জন্য আরও সূচকীয় সংকেত যোগ করুন, যেমন ট্র্যাফিকের পরিমাণ।
-
মেশিন লার্নিং মডেল যুক্ত করুন, মাল্টি-ডিমিটারে প্রশিক্ষণ দিন এবং স্বয়ংক্রিয়ভাবে সর্বোত্তম ট্রেডিং কৌশল সন্ধান করুন।
-
বিভিন্ন জাতের পরামিতি অনুসারে অপ্টিমাইজ করুন, স্বনির্ধারিত পরামিতি সেট করুন <unk>
-
কন্ট্রোল পজিশনের আকারের উপর ভিত্তি করে ঝুঁকি নিয়ন্ত্রণের জন্য স্টপ লস কৌশল এবং কন্ট্রোল পজিশনের আকার বাড়ানো।
-
সংমিশ্রণ অপ্টিমাইজেশান, সংমিশ্রণের জন্য কম প্রাসঙ্গিকতাযুক্ত জাতগুলি সন্ধান করুন, সংমিশ্রণ প্রত্যাহার হ্রাস করুন।
সারসংক্ষেপ
সামগ্রিকভাবে, এই কৌশলটি স্বল্পমেয়াদী প্রবণতা ট্রেডিংয়ের জন্য উপযুক্ত। এটি সিদ্ধান্ত নেওয়ার জন্য মাল্টি-ডাইমেনশনাল সূচক ব্যবহার করে, প্রচুর শব্দকে ফিল্টার করে এবং উচ্চতর হার দেয়। তবে সূচকগুলি ভুল সংকেত দেওয়ার ঝুঁকি সম্পর্কে সতর্কতা অবলম্বন করা দরকার। অব্যাহত অপ্টিমাইজেশনের মাধ্যমে, এই কৌশলটি কার্যকর এবং স্থিতিশীল সংক্ষিপ্ত লাইন কৌশল হওয়ার সম্ভাবনা রয়েছে।
- 1