বহু-সময়সীমার লাভ গ্রহণের কৌশল

ওভারভিউ
এই কৌশলটি একাধিক সময় ফ্রেমে স্টপ ম্যানেজমেন্টের লক্ষ্যে তৈরি করা হয়েছে। এই কৌশলটি একই সাথে শতাংশ স্টপ এবং মূল সময় ফ্রেমের উপরে মূল মূল্য অঞ্চল স্টপ ব্যবহার করে, যাতে আরও সুনির্দিষ্ট এবং আরও কার্যকর স্টপ ম্যানেজমেন্ট করা যায়।
কৌশল নীতি
এই কৌশলটি প্রথমে তরঙ্গ প্রবণতা সূচকটি প্রবর্তন করে এবং সূচকটির উপর ভিত্তি করে গোল্ডফর্কে একাধিক সংকেত প্রবেশ করে।
স্টপ ম্যানেজমেন্টের ক্ষেত্রে, এই কৌশলটি দুটি পদ্ধতিতে কাজ করেঃ
-
শতকরা সীমাবদ্ধতাঃ প্রবেশ মূল্যের নির্দিষ্ট শতাংশের উপর ভিত্তি করে একাধিক সীমাবদ্ধ মূল্য নির্ধারণ করুন।
-
মাল্টি টাইম ফ্রেম স্টপঃ দৈনিক লাইন এবং 4 ঘন্টা লাইন চার্ট উপর গড় লাইন আঁকা, এবং এই গড় লাইন দাম হিসাবে স্টপ মূল্য নিতে।
শতকরা স্টপ-এর জন্য, কৌশলটি 4 টি বিভিন্ন শতাংশে স্টপ-এর মূল্য নির্ধারণ করে। যখন মূল্য প্রতিটি স্টপ-এর মূল্য স্পর্শ করে, তখন সেট করা শতাংশের উপর ভিত্তি করে অংশটি খালি করা হয়।
একাধিক সময় ফ্রেম স্টপ জন্য, কৌশল দিন লাইন এবং 4 ঘন্টা লাইন উপর যথাক্রমে 100 দিন গড় লাইন, 200 দিন গড় লাইন আঁকা। এই গড় লাইন মূল্য হিসাবে স্টপ মূল্য নিতে, যখন মূল্য স্পর্শ প্লেইন।
এছাড়াও, কৌশলটি একটি স্টপ লস মূল্য নির্ধারণ করে। যখন দামটি স্টপ লস মূল্যের নীচে থাকে, তখন সমস্ত পজিশন খালি থাকে।
এই সমগ্র কৌশলটি শতাংশ এবং বহু-সময়-ফ্রেম স্টপ ব্যবহারের সমন্বয়ে স্টপ ম্যানেজমেন্টকে আরও ব্যাপক এবং সুনির্দিষ্ট করে তোলে।
কৌশলগত সুবিধা
-
শতকরা হিমায়িত হিমায়িত ব্যবহার করুন, নির্দিষ্ট অনুপাত অনুযায়ী হিমায়িত করুন, খুব তাড়াতাড়ি হিমায়িত হওয়া বা অল্প হিমায়িত হওয়া এড়াতে।
-
মাল্টিটাইম ফ্রেম বিশ্লেষণের মাধ্যমে, স্টপ-অফ মূল্য নির্ধারণ করা এবং স্টপ-অফ পয়েন্ট নির্বাচন করা।
-
মাল্টি-লেভেল স্ট্রোক, স্ট্রোকের ঝুঁকি কমাতে বিভিন্ন স্তরে স্ট্রোক করা যায়।
-
স্টপ লস প্রাইস সেট করুন এবং নিচের দিকে ঝুঁকি নিয়ন্ত্রণ করুন।
-
শতকরা স্ট্রিং এবং মাল্টি টাইম ফ্রেম স্ট্রিংয়ের সমন্বয়, স্ট্রিং আরও ব্যাপক এবং সুনির্দিষ্ট।
ঝুঁকি বিশ্লেষণ
-
শতকরা হারটি প্যারামিটার সেটিংয়ের উপর নির্ভর করে, যদি প্যারামিটারটি ভুলভাবে সেট করা হয় তবে এটি খুব তাড়াতাড়ি বা খুব দেরিতে থামতে পারে।
-
মাল্টিটাইম ফ্রেম বিশ্লেষণ গড়রেখার উপর নির্ভর করে, গড়রেখার কিছুটা পিছিয়ে রয়েছে, এটি বিপরীত হতে পারে।
-
ভুলভাবে স্টপ সেট করলে অপ্রয়োজনীয় ক্ষতি হতে পারে।
-
সঠিকভাবে অনুকূলিতকরণের পরামিতি প্রয়োজন, যাতে শতাংশ স্টপ এবং মাল্টি-টাইম ফ্রেম স্টপ সর্বোত্তম মিল হয়।
অপ্টিমাইজেশান দিক
-
আপনি আরো গড় পরিমাপ পরীক্ষা করতে পারেন, এবং একটি ভাল গড় পরিমাপ হিসাবে একটি সমালোচনামূলক স্টপ মূল্য নির্বাচন করতে পারেন।
-
মডেল ভবিষ্যদ্বাণী পদ্ধতির চেষ্টা করা যেতে পারে, যা মূল্যের গুরুত্বপূর্ণ অঞ্চলগুলিকে স্টপ-অফ মূল্য হিসাবে পূর্বাভাস দেয়।
-
আরও কিছু স্টপিং নিয়ম যেমন, প্রত্যাশিত স্টপিং অনুপাত, সরানো স্টপিং ইত্যাদি চালু করা যেতে পারে, যাতে স্টপিং আরও ব্যাপক হয়।
-
বিভিন্ন পজিশনের জন্য সর্বোত্তম শতাংশ বন্ধের পরামিতি পরীক্ষা করা যায়।
-
রিটার্নের মাধ্যমে স্টপ-অফ প্যারামিটারগুলিকে অপ্টিমাইজ করা যেতে পারে, যা সামগ্রিক ঝুঁকি-লাভের তুলনায় ভাল।
সারসংক্ষেপ
এই কৌশলটি শতাংশ স্টপ এবং মাল্টি-টাইম ফ্রেম স্টপিংয়ের সমন্বয় করে নমনীয় এবং সুনির্দিষ্ট স্টপ ম্যানেজমেন্ট অর্জন করে। কৌশলটির আরও ভাল স্টপ পয়েন্ট নির্বাচন এবং স্টপিংয়ের আরও বিস্তৃত সুবিধা রয়েছে। প্যারামিটার সেটআপ, স্টপ লস অবস্থান ইত্যাদির মতো সমস্যাও রয়েছে। পরবর্তী সময়ে স্টপ প্যারামিটারগুলি অনুকূলিতকরণ, আরও স্টপ নিয়ম যুক্ত করা ইত্যাদির ক্ষেত্রে উন্নতি করা যেতে পারে, যাতে কৌশলটির স্টপিং সিস্টেম আরও উন্নত হয়।
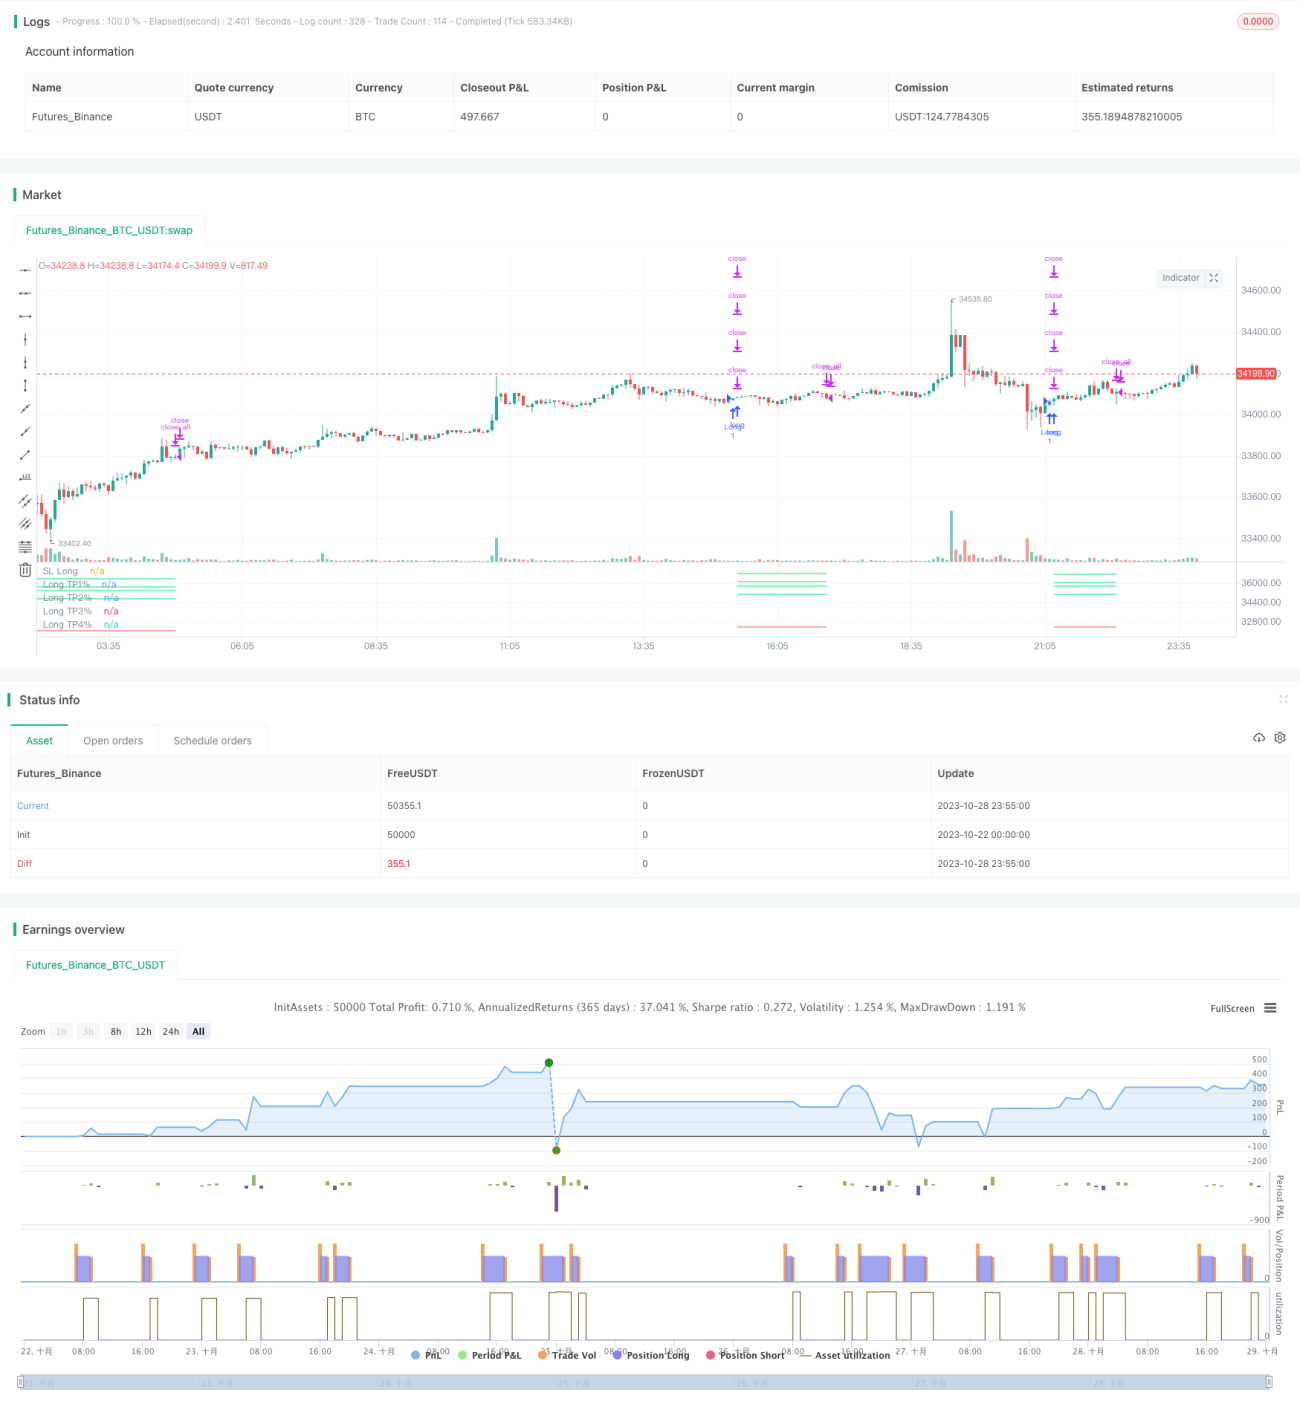
/*backtest
start: 2023-10-22 00:00:00
end: 2023-10-29 00:00:00
period: 5m
basePeriod: 1m
exchanges: [{"eid":"Futures_Binance","currency":"BTC_USDT"}]
*/

// This source code is subject to the terms of the Mozilla Public License 2.0 at https://mozilla.org/MPL/2.0/
// © TrendCrypto2022
//@version=5
// strategy("Take profit Multi timeframe", overlay=true, margin_long=100, margin_short=100)- 1