উচ্চ-স্তরের চলমান গড় যুগান্তকারী কৌশল

ওভারভিউ
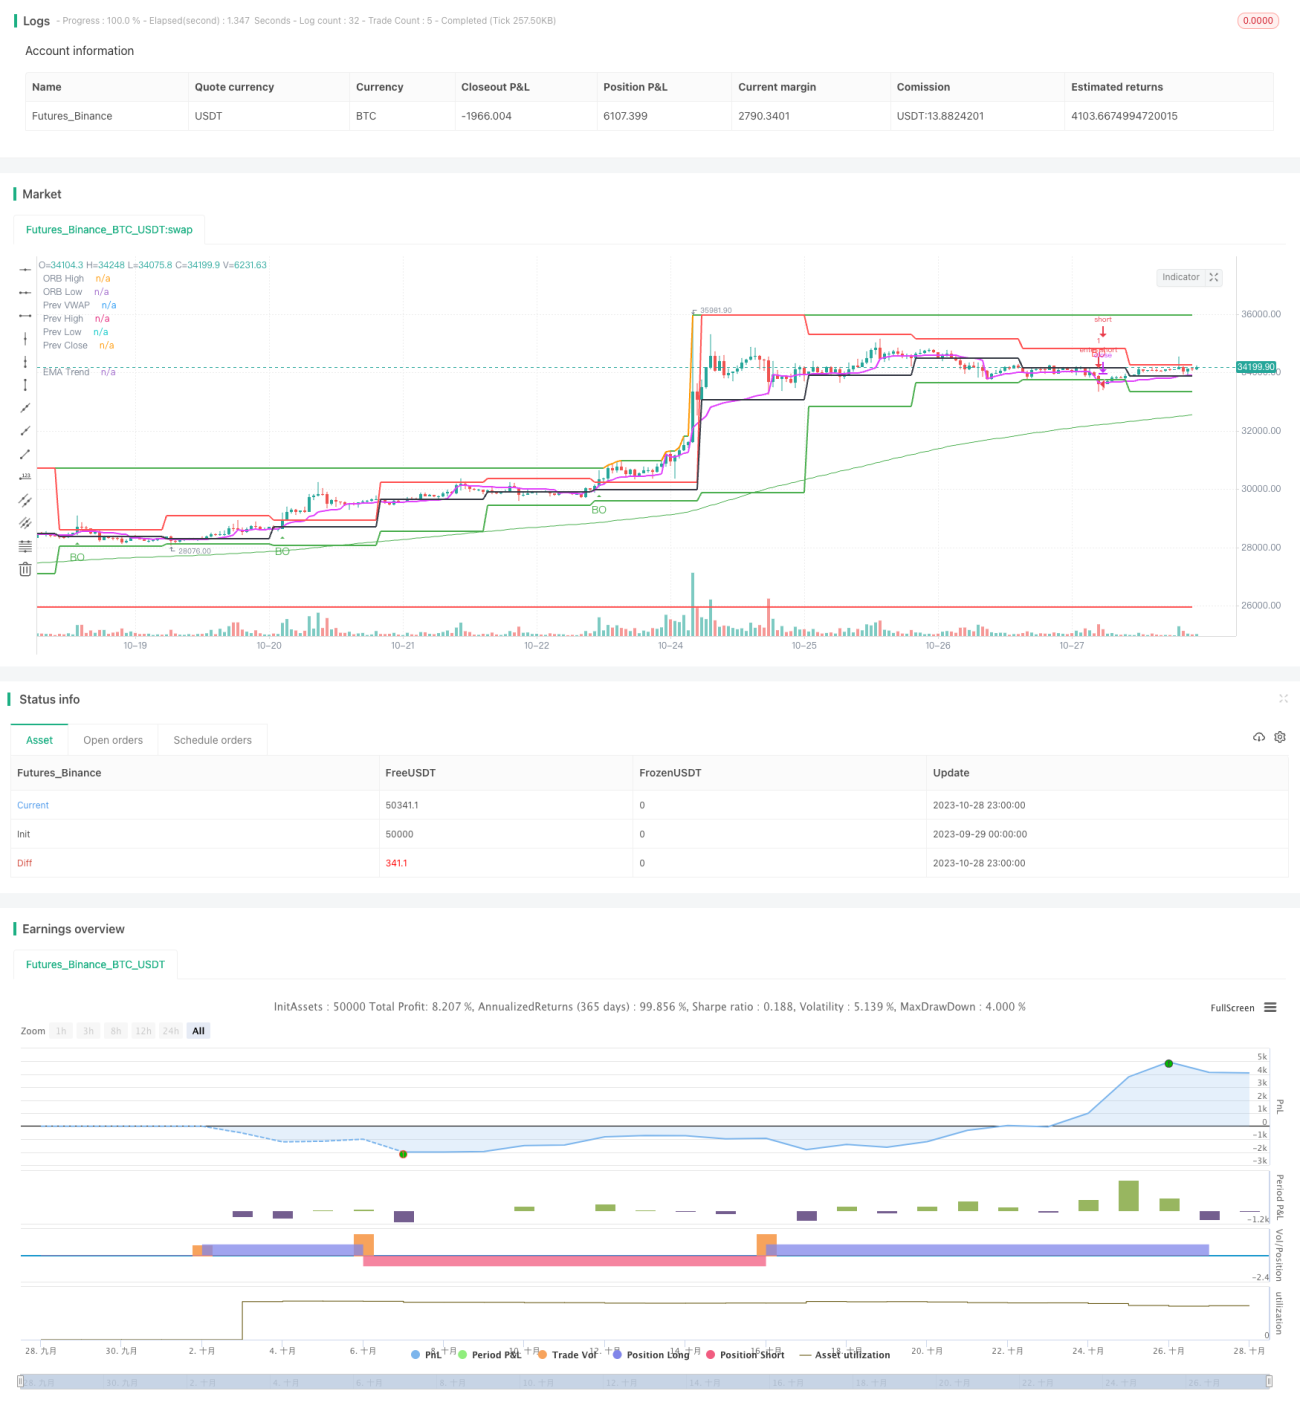
এই কৌশলটির মূল ধারণাটি হ'ল ট্রেডিংয়ের জন্য উচ্চ স্তরের গড়ের ব্রেকডাউন ব্যবহার করা। উচ্চ স্তরের সময়সীমার মধ্যে, যখন দামগুলি গড়ের ব্রেকডাউন বা ব্রেকডাউন করে তখন ট্রেডিংয়ের শুরুটি নির্ধারণ করা যায়, যখন উপযুক্ত দিকনির্দেশনা অনুসরণ করা যায়।
কৌশল নীতি
এই কৌশলটি পাইন স্ক্রিপ্ট ভাষায় তৈরি করা হয়েছে এবং এটি নিম্নলিখিত অংশে বিভক্তঃ
-
ইনপুট প্যারামিটার
সমান্তরাল সময়কালের পরামিতি period সংজ্ঞায়িত করা হয়েছে, ডিফল্ট মান হল 200; K-লাইন সময়কালের পরামিতি timeframe সংজ্ঞায়িত করা হয়েছে, ডিফল্ট মান হল "D" <unk>
-
গড় রেখা গণনা
ta.ema ফাংশন ব্যবহার করে এক্সপোনেন্সিয়াল মুভিং এভারেজের গড় রেখা নির্ণয় করুন।
-
বিচার বিভাজন
ta.crossover এবং ta.crossunder ফাংশন ব্যবহার করে মূল্যায়ন করুন যে দামটি গড় রেখা অতিক্রম করেছে বা অতিক্রম করেছে কিনা।
-
সংকেত ম্যাপিং
যখন একটি ব্রেকআউট ঘটে তখন K লাইনে উপরে বা নিচে তীর আঁকুন।
-
ট্রেডিং বন্ধ
একটি ব্রেকআউটের সময় পজিশন খোলার দিকনির্দেশনা বেছে নিন এবং ডাবল স্টপ লস দূরত্বের পরে পজিশনটি সমতল করুন।
এই কৌশলটি মূলত উচ্চ স্তরের গড়রেখার প্রবণতা নির্ধারণের দক্ষতার উপর নির্ভর করে এবং প্রবণতা ট্র্যাকিংয়ের জন্য সহজ ব্রেকআপ অপারেশন দ্বারা প্রচলিত ব্রেকআপ কৌশলগুলির মধ্যে রয়েছে।
সামর্থ্য বিশ্লেষণ
এই কৌশলটির কিছু সুবিধা রয়েছেঃ
-
ধারণাটি সহজ, সহজে বোঝা যায় এবং আয়ত্ত করা যায়।
-
শুধুমাত্র একটি গড় রেখা সূচক উপর নির্ভর করে, প্যারামিটার সমন্বয় সহজ।
-
বিরাট ট্রেন্ডিংয়ের জন্য সহজ এবং খুব কমই ট্রেডিং করা হয়।
-
উচ্চ পর্যায়ের চক্রগুলি স্পষ্টভাবে বড় প্রবণতা প্রদর্শন করে এবং স্বল্পমেয়াদী ওঠানামা দ্বারা প্রভাবিত হয় না।
-
বিভিন্ন প্রজাতির জন্য বিভিন্ন সময়কালের সমন্বয় কনফিগার করা যায়।
-
এই প্রজাতিগুলোকে সহজেই একাধিক প্রজাতির মধ্যে ভাগ করা যায়, কিন্তু একই সময়ে তাদের আটকে রাখা কঠিন।
ঝুঁকি বিশ্লেষণ
এই কৌশলটির কিছু ঝুঁকিও রয়েছেঃ
-
ব্রেকিং সিগন্যালের ফলে বাজারের অস্থিরতা কার্যকরভাবে ফিল্টার করতে ব্যর্থ হতে পারে।
-
এই সংক্ষিপ্ত লাইনের সুযোগগুলি ব্যবহার করে লাভবান হওয়া যায় না।
-
তবে, যদি আপনি ভুল সিদ্ধান্ত নেন, তাহলে ক্ষতির পরিমাণ অনেক বেশি হতে পারে।
-
গড় লাইন চক্র এবং লেনদেনের চক্রের সাথে মিল না থাকলে, অত্যধিক লেনদেন বা ক্ষতির ঘটনা ঘটে।
-
"আমি মনে করি, এই পরিস্থিতিতে, আমরা আমাদের লক্ষ্যে পৌঁছাতে পারবো না।
ঝুঁকি মোকাবেলার সমাধানগুলির মধ্যে রয়েছেঃ প্রবণতা সূচকগুলির সমন্বয়, ফিল্টারিং শর্ত বাড়ানো, যথাযথভাবে হোল্ডিং পিরিয়ডগুলি সংক্ষিপ্ত করা, স্টপ লস পজিশনের গতিশীল সমন্বয় ইত্যাদি।
অপ্টিমাইজেশান দিক
এই কৌশলটি নিম্নলিখিত দিকগুলি থেকে অপ্টিমাইজ করা যেতে পারেঃ
-
প্রবণতা সূচকগুলির সমন্বয় যেমন MACD, KD ইত্যাদি বৃদ্ধি করে, যা ব্রেকআউটের নির্ভরযোগ্যতা বাড়ায়।
-
ভুয়া ব্রেকডাউন এড়ানোর জন্য ট্রেডিং ভলিউম বা ব্রিন লাইন চ্যানেলের মতো ফিল্টারিং শর্তগুলি বাড়ান।
-
অপ্টিমাইজড প্যারামিটার চক্রের মিল, যাতে হোল্ডিং চক্রটি প্রবণতা চক্রের সাথে আরও মিলিত হয়
-
রিয়েল-টাইম স্টপ লস কৌশল যুক্ত করা হয়েছে, যা স্টপ লস ট্র্যাকিংয়ের মাধ্যমে একক ক্ষতি নিয়ন্ত্রণ করে।
-
মেশিন লার্নিং প্রযুক্তির সাথে যুক্ত প্যারামিটারগুলির গতিশীল অপ্টিমাইজেশান বিবেচনা করুন।
-
বিভিন্ন ধরণের সম্পদ বিন্যাস করার চেষ্টা করুন এবং সামগ্রিক স্থিতিশীলতা বাড়ান।
সারসংক্ষেপ
এই কৌশলটি সামগ্রিকভাবে সহজ এবং ব্যবহারিক, সহজ সমান্তরাল ব্রেকিংয়ের মাধ্যমে প্রবণতা ট্র্যাকিংয়ের জন্য সহজ, সহজেই আয়ত্ত করা যায়, এটি পরিমাণগত ব্যবসায়ের প্রবেশের কৌশলগুলির মধ্যে একটি হিসাবে কাজ করতে পারে। তবে কিছু সমস্যা রয়েছে, কৌশলটি আরও স্থিতিশীল এবং কার্যকর করার জন্য সমন্বয় সূচক, অপ্টিমাইজেশন প্যারামিটার, গতিশীল স্টপ লস ইত্যাদির মাধ্যমে উন্নতি করা দরকার। অপ্টিমাইজেশনের জন্য প্রচুর জায়গা এবং স্কেলযোগ্যতা রয়েছে।
- 1