
হাই-এসি এবং সুপারট্রেন্ড কৌশল হল একটি ট্রেন্ড ট্র্যাকিং কৌশল যা হাই-এসি চার্ট এবং সুপারট্রেন্ড সূচককে একত্রিত করে। এই কৌশলটি ট্রেন্ডের দিকনির্দেশনা সনাক্ত করতে, ট্রেন্ডের অঞ্চলে ট্রেড করতে এবং যখন ট্রেন্ডটি বিপরীত হয় তখন দ্রুত প্রস্থান করতে, যাতে অ-ট্রেন্ডিং ট্রেডিংয়ের ক্ষয়ক্ষতি সর্বাধিক করা যায়।
হাইনাথোরিয়াম চার্ট একটি বিশেষ K-লাইন চার্ট যা খোলার, বন্ধের, সর্বোচ্চ এবং সর্বনিম্ন মূল্যের গড় মান ব্যবহার করে একটি ক্রেডিট সত্তা আঁকতে পারে, যা বাজারের গোলমালকে ফিল্টার করে এবং চিত্রটি আরও স্পষ্ট করে তোলে। সুপার ট্রেন্ডিং সূচকটি দুটি কার্ভ নিয়ে গঠিত, যা গতিশীল সমর্থন এবং প্রতিরোধের লাইনগুলির মাধ্যমে প্রবণতার দিক নির্ধারণ করে।
এই কৌশলটি প্রথমে হেইন অ্যাসিওর চার্ট গণনা করে এবং তারপরে হেইন অ্যাসিওর কে লাইনের উপর ভিত্তি করে সুপার ট্রেন্ডের সূচক গণনা করে। যখন দাম সুপার ট্রেন্ডের সূচকটি ভেঙে দেয়, তখন একটি লেনদেনের সংকেত তৈরি করে। বিশেষত, এই কৌশলটি হেইন অ্যাসিওর কে লাইনের ব্যবহার করে প্রকৃত তরঙ্গের গণনা করে এবং তারপরে তরঙ্গের আকার এবং গড় মূল্যের সাথে মিলিত হয়ে সুপার ট্রেন্ডের উত্থান-পতন পায়। যখন দাম নীচের ট্র্যাকটি ভেঙে যায় তখন একটি বহু সংকেত উত্পন্ন হয় এবং যখন এটি উপরের ট্র্যাকটি ভেঙে যায় তখন একটি খালি সংকেত উত্পন্ন হয়।
কৌশলটি সুপার ট্রেন্ড সূচকগুলির জন্য প্যারামিটার অপ্টিমাইজেশানও করেছে, সর্বোত্তম প্যারামিটার সমন্বয় ব্যবহার করে, যার ফলে সূচকের সংবেদনশীলতা বৃদ্ধি পায়। তদতিরিক্ত, কৌশলটি স্টপ লস মেশিন যুক্ত করেছে, যা লাভের গ্যারান্টি দেওয়ার সাথে ঝুঁকি নিয়ন্ত্রণ করতে পারে।
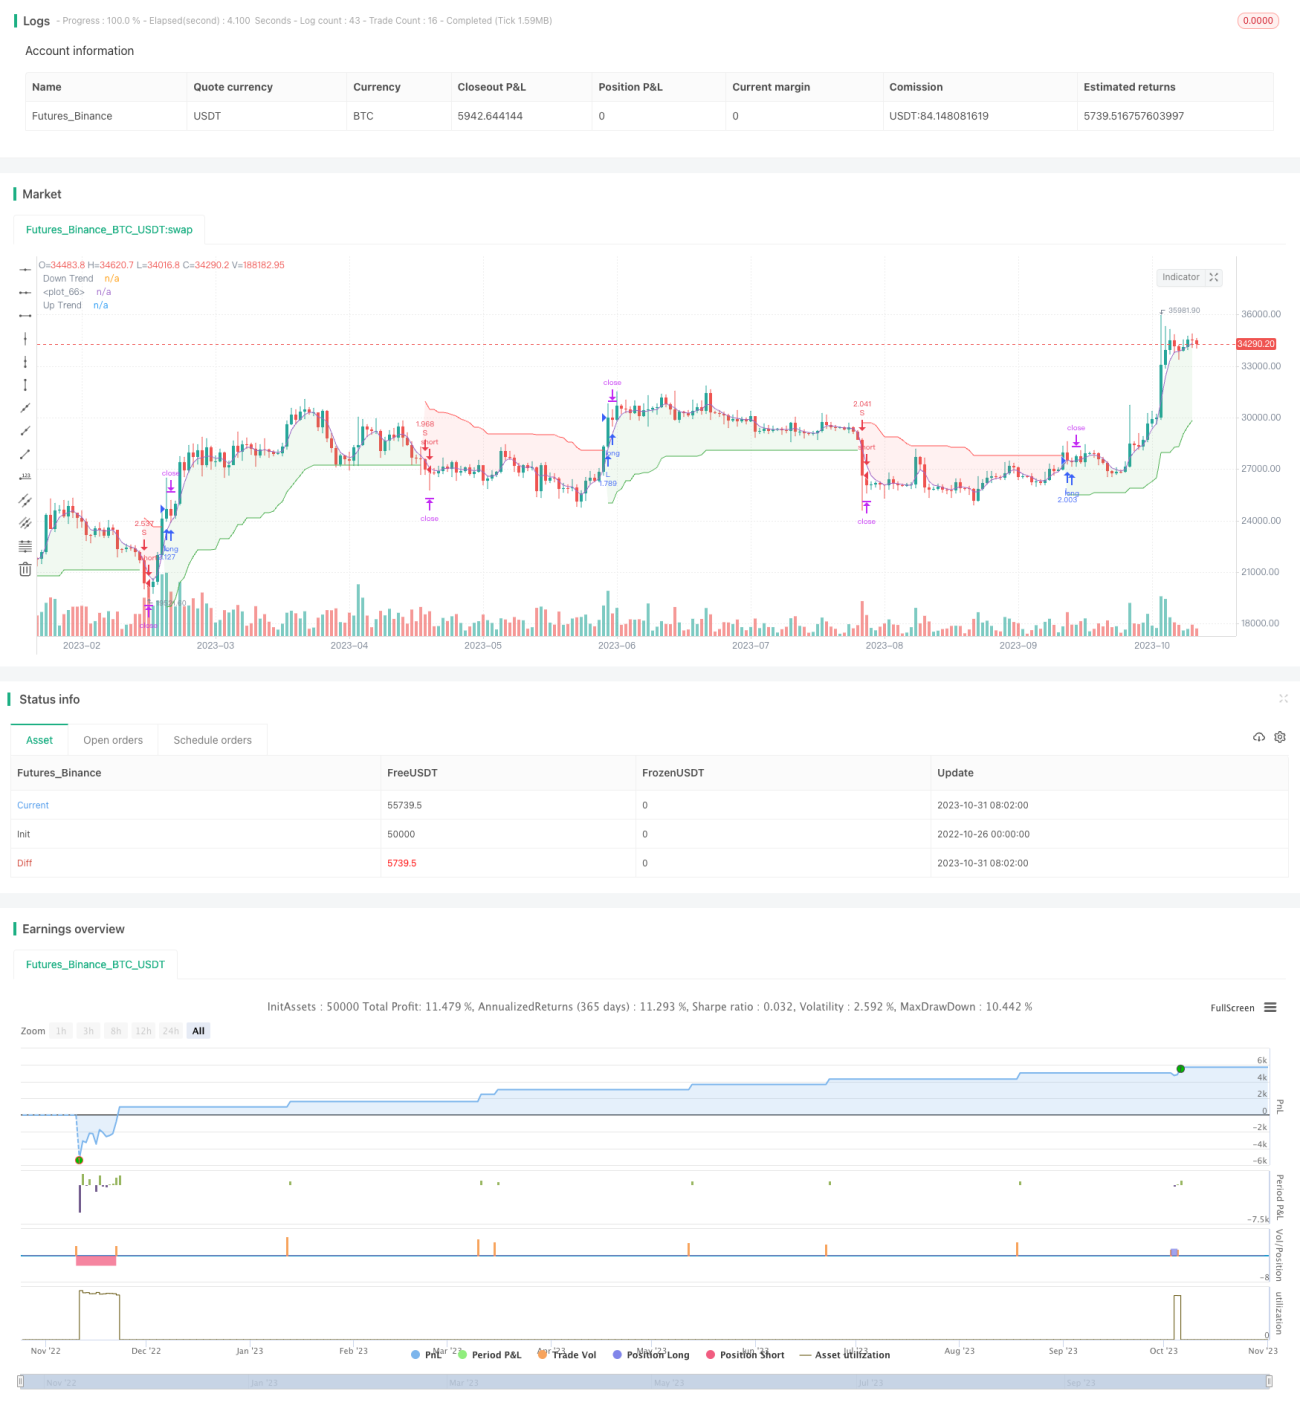
হাইনাথিয়ো এবং সুপারট্রেন্ড কৌশল একটি প্রবণতা অনুসরণ কৌশল। এটি প্রবণতা দিক সনাক্ত করতে পারে, বড় প্রবণতার অধীনে বাণিজ্য করতে পারে এবং বিপরীত হওয়ার সময় দ্রুত বন্ধ হয়ে যায়। কৌশলটি হাইনাথিয়ো প্যাটার্নের গোলমাল ফিল্টারিং এবং সুপারট্রেন্ড সূচকগুলির দ্রুত প্রবণতা পরিবর্তনের ক্যাপচার করার ক্ষমতাকে সংহত করে। প্যারামিটার অপ্টিমাইজেশন এবং স্টপ লস মেশিনের নকশার মাধ্যমে রিটার্ন বাড়ানোর সাথে সাথে ঝুঁকি নিয়ন্ত্রণ করতে সক্ষম। ভবিষ্যতে প্যারামিটারগুলি আরও অপ্টিমাইজ করে, নিশ্চিতকরণ সূচকগুলি যুক্ত করে, ব্যাকমেটিং ডেটা প্রসারিত করে এই কৌশলটি অপ্টিমাইজ করা যেতে পারে, যা সিস্টেমের স্থায়িত্ব এবং নির্ভরযোগ্যতা উন্নত করে।
/*backtest
start: 2022-10-26 00:00:00
end: 2023-11-01 00:00:00
period: 1d
basePeriod: 1h
exchanges: [{"eid":"Futures_Binance","currency":"BTC_USDT"}]
*/
//@version=5
strategy("Heiken Ashi & Super Trend_ARM", overlay=true, pyramiding=1,initial_capital = 10000, default_qty_type= strategy.percent_of_equity, default_qty_value = 100, calc_on_order_fills=false, slippage=0,commission_type=strategy.commission.percent,commission_value=0.02)
///////////////////////////////////////////////////
////////////////////Function///////////////////////
///////////////////////////////////////////////////
heikinashi_open = request.security(ticker.heikinashi(syminfo.tickerid), timeframe.period, open)
heikinashi_high = request.security(ticker.heikinashi(syminfo.tickerid), timeframe.period, high)
heikinashi_low = request.security(ticker.heikinashi(syminfo.tickerid), timeframe.period, low)
heikinashi_close= request.security(ticker.heikinashi(syminfo.tickerid), timeframe.period, close)
heikinashi_color = heikinashi_open < heikinashi_close ? #53b987 : #eb4d5c
// plotbar(heikinashi_open, heikinashi_high, heikinashi_low, heikinashi_close, color=heikinashi_color)
x_sma(x, y) =>
sumx = 0.0
for i = 0 to y - 1
sumx := sumx + x[i] / y
sumx
x_rma(src, length) =>
alpha = 1/length
sum = 0.0
sum := na(sum[1]) ? x_sma(src, length) : alpha * src + (1 - alpha) * nz(sum[1])
x_atr(length) =>
trueRange = na(heikinashi_high[1])? heikinashi_high-heikinashi_low : math.max(math.max(heikinashi_high - heikinashi_low, math.abs(heikinashi_high - heikinashi_close[1])), math.abs(heikinashi_low - heikinashi_close[1]))
//true range can be also calculated with ta.tr(true)
x_rma(trueRange, length)
x_supertrend(factor, atrPeriod) =>
src = (heikinashi_high+heikinashi_low)/2
atr = x_atr(atrPeriod)
upperBand = src + factor * atr
lowerBand = src - factor * atr
prevLowerBand = nz(lowerBand[1])
prevUpperBand = nz(upperBand[1])
lowerBand := lowerBand > prevLowerBand or heikinashi_close[1] < prevLowerBand ? lowerBand : prevLowerBand
upperBand := upperBand < prevUpperBand or heikinashi_close[1] > prevUpperBand ? upperBand : prevUpperBand
int direction = na
float superTrend = na
prevSuperTrend = superTrend[1]
if na(atr[1])
direction := 1
else if prevSuperTrend == prevUpperBand
direction := heikinashi_close > upperBand ? -1 : 1
else
direction := heikinashi_close < lowerBand ? 1 : -1
superTrend := direction == -1 ? lowerBand : upperBand
[superTrend, direction]
///////////////////////////////////////////////////
////////////////////Indicators/////////////////////
///////////////////////////////////////////////////
factor = input.float(3.0, "Factor", step = 0.01)
atrPeriod = input(10, "ATR Length")
[supertrend, direction] = x_supertrend(factor, atrPeriod)
bodyMiddle = plot((heikinashi_open + heikinashi_close) / 2, display=display.none)
upTrend = plot(direction < 0 ? supertrend : na, "Up Trend", color = color.green, style=plot.style_linebr)
downTrend = plot(direction < 0? na : supertrend, "Down Trend", color = color.red, style=plot.style_linebr)
fill(bodyMiddle, upTrend, color.new(color.green, 90), fillgaps=false)
fill(bodyMiddle, downTrend, color.new(color.red, 90), fillgaps=false)
///////////////////////////////////////////////////
////////////////////Strategy///////////////////////
///////////////////////////////////////////////////
var bool longCond = na, var bool shortCond = na, longCond := nz(longCond[1]), shortCond := nz(shortCond[1])
var int CondIni_long = 0, var int CondIni_short = 0, CondIni_long := nz(CondIni_long[1]), CondIni_short := nz(CondIni_short[1])
var float open_longCondition = na, var float open_shortCondition = na
long = ta.change(direction) < 0
short = ta.change(direction) > 0
longCond := long
shortCond := short
CondIni_long := longCond[1] ? 1 : shortCond[1] ? -1 : nz(CondIni_long[1])
CondIni_short := longCond[1] ? 1 : shortCond[1] ? -1 : nz(CondIni_short[1])
longCondition = (longCond[1] and nz(CondIni_long[1]) == -1)
shortCondition = (shortCond[1] and nz(CondIni_short[1]) == 1)
open_longCondition := long ? close[1] : nz(open_longCondition[1])
open_shortCondition := short ? close[1] : nz(open_shortCondition[1])
//TP
tp = input.float(1.1 , "TP [%]", step = 0.1)
//BACKTESTING inputs --------------------------------------------------------------------------------------------------------------------------------------------------------------------------------------------------------------------------------------------------------------------------------------------------------
testStartYear = input.int(2000, title="start year", minval = 1997, maxval = 3000, group= "BACKTEST")
testStartMonth = input.int(01, title="start month", minval = 1, maxval = 12, group= "BACKTEST")
testStartDay = input.int(01, title="start day", minval = 1, maxval = 31, group= "BACKTEST")
testPeriodStart = timestamp(testStartYear,testStartMonth,testStartDay,0,0)
testStopYear = input.int(3333, title="stop year", minval=1980, maxval = 3333, group= "BACKTEST")
testStopMonth = input.int(12, title="stop month", minval=1, maxval=12, group= "BACKTEST")
testStopDay = input.int(31, title="stop day", minval=1, maxval=31, group= "BACKTEST")
testPeriodStop = timestamp(testStopYear, testStopMonth, testStopDay, 0, 0)
testPeriod = time >= testPeriodStart and time <= testPeriodStop ? true : false
// Backtest ==================================================================================================================================================================================================================================================================================================================================
if longCond
strategy.entry("L", strategy.long, when=testPeriod)
if shortCond
strategy.entry("S", strategy.short, when=testPeriod)
strategy.exit("TP_L", "L", profit =((open_longCondition * (1+(tp/100))) - open_longCondition)/syminfo.mintick)
strategy.exit("TP_S", "S", profit =((open_shortCondition * (1+(tp/100))) - open_shortCondition)/syminfo.mintick)