সুপার ইচিমোকু ট্রেন্ড কৌশল

ওভারভিউ
ওভার ওয়ান কৌশল হল ট্রেডিং সিদ্ধান্ত নেওয়ার জন্য ওভার ওয়ান সূচকের উপর ভিত্তি করে প্রবণতা ট্রেডিং কৌশল। এই কৌশলটি ওভার ওয়ান সূচকের রূপান্তর লাইন, বেঞ্চমার্ক লাইন এবং ক্লাউডব্যান্ডের সম্পর্ককে বর্তমান প্রবণতার দিকনির্দেশের জন্য ব্যবহার করে এবং দামের রিটার্নের সাথে মিলিত হয়।
সুপার ওয়ান কৌশলটি প্রধানত মাঝারি-দীর্ঘ লাইনের ট্রেন্ড ট্রেডিংয়ের জন্য প্রযোজ্য, এটি বৃহত্তর প্রবণতাগুলিতে লাভ করতে পারে। এই কৌশলটি একই সাথে প্রবণতা সনাক্তকরণের শক্তিশালী ক্ষমতা রয়েছে।
কৌশল নীতি
এই কৌশলটি মূলত নিম্নলিখিত বিষয়গুলির উপর ভিত্তি করে পরিচালিত হয়ঃ
-
রূপান্তর লাইন এবং বেঞ্চমার্ক লাইনের সম্পর্কঃযখন ট্রান্সফর্মার লাইন উপরে থাকে, তখন এটি উঁচুতে থাকে এবং যখন এটি নীচে থাকে তখন এটি নীচে থাকে।
-
মেঘের রঙঃযখন মেঘগুলি সবুজ হয়, তখন তারা মুকুট দেখায় এবং যখন লাল হয় তখন তারা পতন দেখায়।
-
দামের পুনর্বিবেচনাঃমূল্য পুনরুদ্ধার রূপান্তর লাইন এবং বেঞ্চমার্ক লাইনের বাইরে প্রবেশের প্রয়োজন
এই কৌশলটির জন্য ট্রেডিং সিগন্যালগুলি হলঃ
সিগন্যাল দিনঃ
- রূপান্তর লাইন বেসলাইন থেকে উচ্চতর
- রূপান্তর লাইন এবং বেঞ্চমার্ক লাইনের চেয়ে বেশি দাম
- ট্রান্সফরমার লাইন এবং বেঞ্চমার্ক লাইন মেঘাচ্ছন্নতার উপরে
- মূল্য পুনরুদ্ধার রূপান্তর লাইন এবং বেঞ্চমার্ক লাইন নীচে
সিগন্যালঃ
- রূপান্তর লাইন বেসলাইন থেকে কম
- রূপান্তর লাইন এবং বেঞ্চমার্ক লাইনের নিচে দাম
- মেঘের নীচে রূপান্তর লাইন এবং বেঞ্চলাইন
- মূল্য পুনরুদ্ধার রূপান্তর লাইন এবং বেঞ্চমার্ক লাইন উপরে
যখন একই সময়ে পজিশন খোলার সিগন্যাল মেটানো হয়, তখন পজিশনের অবস্থা অনুযায়ী পজিশন খোলার কাজ করা হয়।
সামর্থ্য বিশ্লেষণ
একের পর এক কৌশলটির সুবিধাগুলো হলঃ
-
ট্রেন্ডের দিকনির্দেশনা নির্ধারণে সুপার ওয়ান সূচক সমন্বয় ব্যবহার করে, উচ্চ নির্ভুলতা
-
রূপান্তর লাইন এবং বেঞ্চমার্ক লাইন স্বল্পমেয়াদী প্রবণতা এবং মেঘের রেখা দীর্ঘমেয়াদী প্রবণতা নির্ধারণ করে
-
শর্তটি হল মূল্যকে ঘুরিয়ে নেওয়ার লাইনটি পুনরুদ্ধার করা যাতে ভুয়া ব্রেকআউটের ক্ষতি এড়ানো যায়
-
একক ক্ষতির কার্যকর নিয়ন্ত্রণের জন্য সাম্প্রতিক সময়ের সর্বোচ্চ সর্বনিম্ন মূল্যের স্টপ লস ব্যবহার করে ঝুঁকি নিয়ন্ত্রণ
-
সুষ্ঠু মুনাফা অর্জনের জন্য লোভনীয় লাভের চেয়ে লোভনীয় লাভ
-
বিভিন্ন চক্রের জন্য প্রযোজ্য, মধ্য ও দীর্ঘ লাইন ট্রেন্ড ট্রেডিংয়ের জন্য উপযুক্ত
-
কৌশলগুলি পরিষ্কার এবং সহজেই বোঝা যায়, প্যারামিটার অপ্টিমাইজেশনের জন্য প্রচুর জায়গা রয়েছে
-
বিভিন্ন বাজারে ভাল কাজ করে
ঝুঁকি বিশ্লেষণ
এই কৌশলটি নিম্নলিখিত ঝুঁকির সাথে জড়িতঃ
-
স্টপ লস ঘন ঘন ট্রিগার হতে পারে এবং মুনাফা প্রভাবিত করতে পারে
-
ট্রেন্ড দ্রুত পরিবর্তিত হলে, সময়মতো পজিশন পাল্টাতে না পারলে ক্ষতি হতে পারে
-
সেট করা লাভ-ক্ষতি অনুপাত সব জাতের জন্য উপযুক্ত নয়, বিভিন্ন মানের জন্য সংশোধন করা প্রয়োজন
-
মেঘের জাল ভেঙে উঠার পর সীমিত পরিমাণে উত্তোলন করা যায়।
-
নির্দেশক প্যারামিটারগুলি পুনরাবৃত্তি পরীক্ষার অপ্টিমাইজেশনের প্রয়োজন, প্যারামিটারগুলি প্রায়শই সামঞ্জস্য করার জন্য উপযুক্ত নয়
নিম্নলিখিত উপায়ে ঝুঁকি কমাতে পারেনঃ
-
বিভিন্ন চক্র এবং জাতের বৈশিষ্ট্যগুলির সাথে আরও সামঞ্জস্যপূর্ণ করার জন্য প্যারামিটারগুলি অনুকূলিত করুন
-
অন্যান্য সূচকগুলির সাথে মিলিত হয়ে প্রবেশের সংকেতগুলিকে ফিল্টার করে, বাজারের ঝড়ের সময় ভুয়া ব্রেকডাউন এড়াতে
-
গতিশীলভাবে স্টপ-অফ অবস্থান পরিবর্তন করে স্টপ-অফ ট্রিগার হওয়ার সম্ভাবনা হ্রাস করে
-
বিভিন্ন লাভ-ক্ষতি অনুপাত সেটিং পরীক্ষা করুন
-
ট্রেন্ড সিগন্যালের শক্তি নির্ণয় করার জন্য চার্ট আকারের মতো পদ্ধতি ব্যবহার করা হয়
অপ্টিমাইজেশান দিক
একের পর এক কৌশলগুলি নিম্নলিখিত দিকগুলি থেকে অপ্টিমাইজ করা যেতে পারেঃ
-
রূপান্তর লাইন এবং বেঞ্চমার্ক লাইন প্যারামিটারগুলিকে ট্রেড করা জাতের বৈশিষ্ট্যগুলির সাথে আরও সামঞ্জস্যপূর্ণ করার জন্য অনুকূলিত করুন
-
ক্লাউডব্যান্ড প্যারামিটারগুলিকে অপ্টিমাইজ করা যাতে ক্লাউডব্যান্ডগুলি দীর্ঘমেয়াদী প্রবণতা সম্পর্কে আরও সঠিকভাবে বিচার করতে পারে
-
অপ্টিমাইজ করা স্টপ-অ্যালগরিদম যেমন এটিআর-এর উপর ভিত্তি করে স্টপ সেট করা বা গতিশীল স্টপ করা
-
অন্যান্য সূচকের সাথে সংযুক্ত সংকেত ফিল্টারিং, আরও ফিল্টারিং শর্তাদি কনফিগার করুন, ভুল প্রবেশের সম্ভাবনা হ্রাস করুন
-
অপ্টিমাইজেশান লাভ-ক্ষতি অনুপাত সেটিং, বিভিন্ন জাত এবং চক্রের উপর কৌশল অভিযোজিত বৈশিষ্ট্য
-
মার্টিনগেল পদ্ধতিতে পজিশনের ব্যবস্থাপনা, বিভিন্ন বাজারের ওঠানামা ফ্রিকোয়েন্সির সাথে সামঞ্জস্যপূর্ণ
-
মেশিন লার্নিং পদ্ধতি ব্যবহার করে প্যারামিটারগুলিকে অপ্টিমাইজ করুন, উচ্চতর স্থায়িত্ব অর্জন করুন
-
বিভিন্ন ট্রেডিং সময়ের জন্য সেট করুন, রাতের এবং দিনের মধ্যে ট্রেডিং বৈশিষ্ট্যগুলির সাথে সামঞ্জস্য করুন
সারসংক্ষেপ
সুপার ওয়ান কৌশলটি সামগ্রিকভাবে একটি কৌশল যা মাঝারি এবং দীর্ঘ লাইন ট্রেন্ড ট্রেডিংয়ের জন্য উপযুক্ত। সুপার ওয়ান সূচকটি প্রবণতার দিকনির্দেশের সুবিধাগুলি স্পষ্ট করে তোলে, এবং দামের পুনরুদ্ধারের সাথে মিলিতভাবে প্রবেশের কার্যকরভাবে ভুল প্রবেশকে এড়াতে পারে। অপ্টিমাইজেশন প্যারামিটার সেটিংয়ের মাধ্যমে, কৌশলটি আরও জাতের এবং আরও চক্রের উপর স্থিতিশীল মুনাফা অর্জন করতে পারে। এই কৌশলটি সহজেই বোঝা যায় এবং প্রচুর অপ্টিমাইজেশন স্পেস রয়েছে, যা কৌশল গবেষণা এবং শেখার অন্যতম প্রাথমিক কৌশল হিসাবে উপযুক্ত।
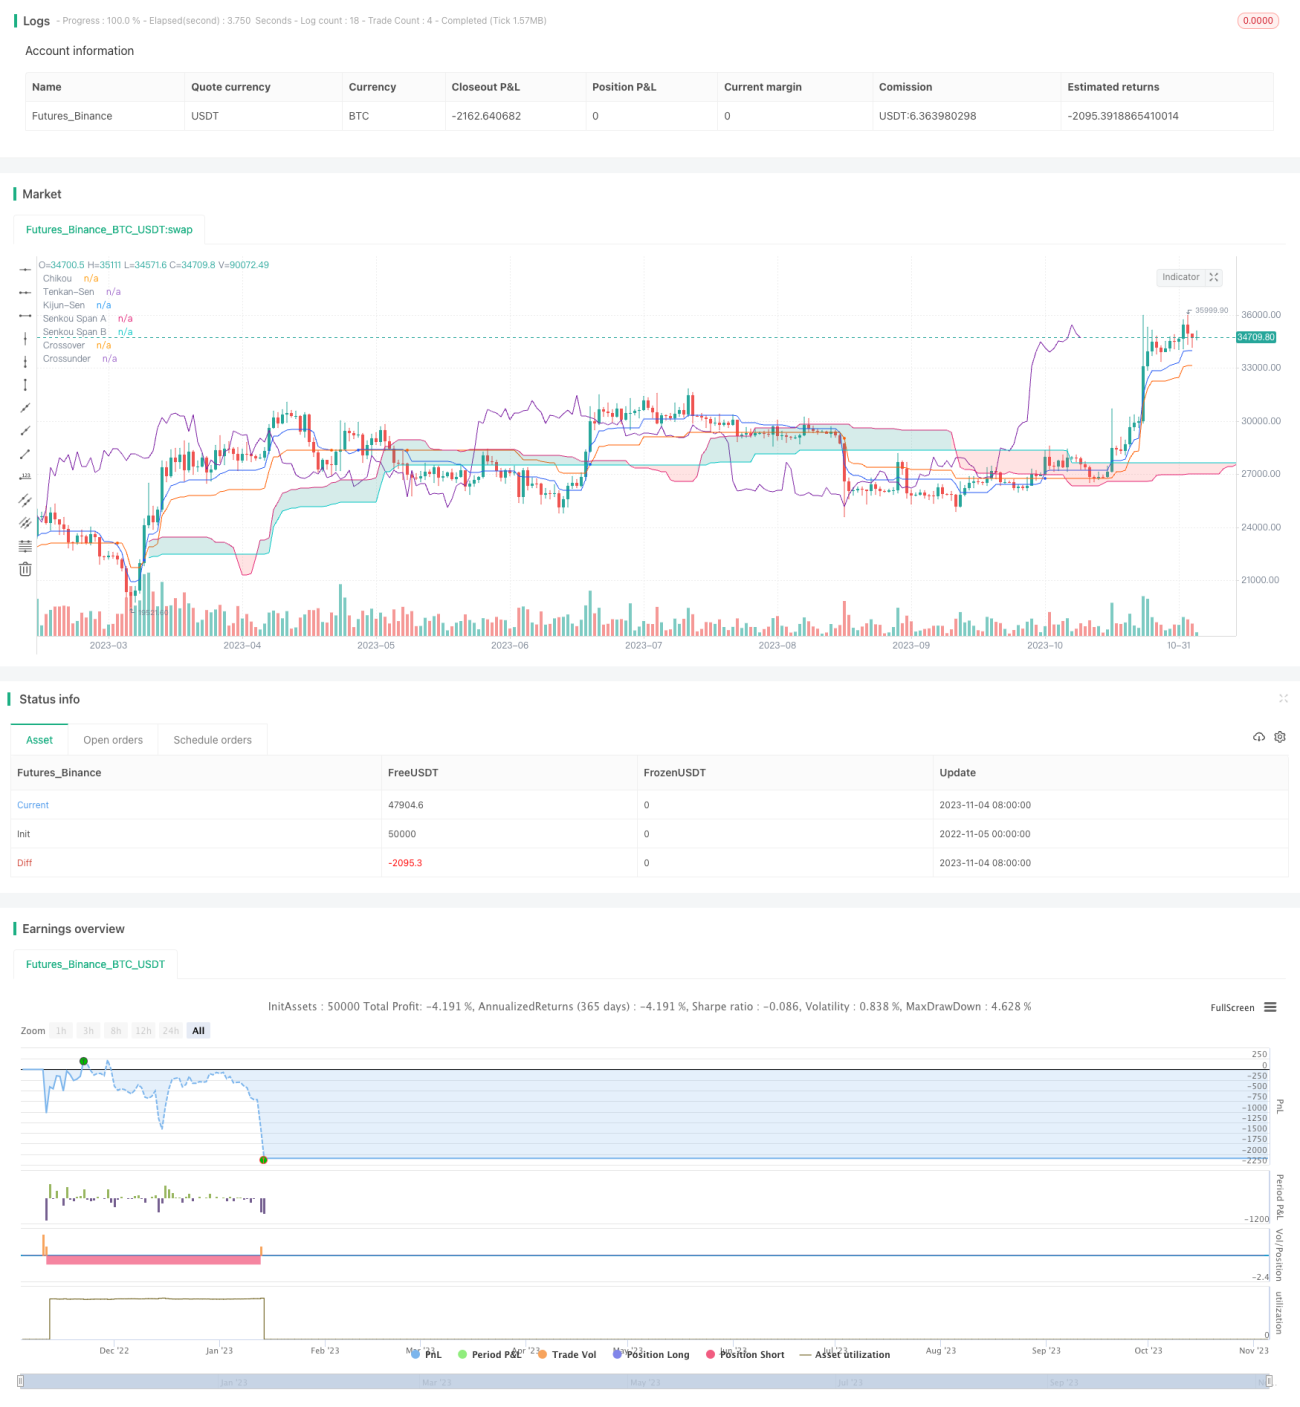
/*backtest
start: 2022-11-05 00:00:00
end: 2023-11-05 00:00:00
period: 1d
basePeriod: 1h
exchanges: [{"eid":"Futures_Binance","currency":"BTC_USDT"}]
*/

// Strategy based on the the SuperIchi indicator.
//
// Strategy was designed for the purpose of back testing.
// See strategy documentation for info on trade entry logic.- 1