ডাবল মুভিং এভারেজ ক্রসওভার রিভার্সাল কৌশল

1
Follow
1779
Followers
ওভারভিউ
এই কৌশলটির মূল ধারণা হল দ্রুত চলমান গড় এবং ধীর চলমান গড়ের সংমিশ্রণ ব্যবহার করে বাজারের প্রবণতা নির্ধারণ করা এবং সংক্ষিপ্ত এবং দীর্ঘ লাইন গড়ের বিপরীত হওয়ার সময় প্রবেশ করা, ট্রেন্ড ট্র্যাকিংয়ের প্রভাব অর্জনের জন্য।
কৌশল নীতি
- দ্রুত চলমান গড় সময়কাল shortma (ডিফল্ট 7 দিন) এবং ধীর চলমান গড় সময়কাল longma (ডিফল্ট 77 দিন) সেট করুন
- যখন সংক্ষিপ্ত লাইন গড় লাইনের উপর দীর্ঘ লাইন অতিক্রম করে তখন এটি কেনার সংকেত হিসাবে বিচার করা হয়, যা barssince ((mabuy) হিসাবে রেকর্ড করা হয়, দীর্ঘ লাইনটি ট্রেন্ডে প্রবেশের অর্থ; যখন সংক্ষিপ্ত লাইন গড় লাইনের নীচে দীর্ঘ লাইন অতিক্রম করে তখন এটি বিক্রয় সংকেত হিসাবে বিচার করা হয়, যা barssince ((masell)) হিসাবে রেকর্ড করা হয়, দীর্ঘ লাইনটি ট্রেন্ডের সমাপ্তি বোঝায়
- তুলনা করুন barssince আকার, সংক্ষিপ্ত গড় লাইন গড় লাইন থেকে উপরে থেকে নীচে ক্রস বার সংখ্যা আরো প্রবণতা দীর্ঘস্থায়ী প্রতিনিধিত্ব করে; বিপরীতভাবে, সংক্ষিপ্ত গড় লাইন গড় লাইন থেকে নীচে থেকে উপরে ক্রস বার সংখ্যা আরো শক্তিশালী বিপরীত সিগন্যাল প্রতিনিধিত্ব করে
- যখন বিক্রয় সংকেতের বার সংখ্যা ক্রয় সংকেতের বার সংখ্যার চেয়ে বেশি হয় তখন একটি ক্রয় সংকেত দেওয়া হয়; যখন ক্রয় সংকেতের বার সংখ্যা বিক্রয় সংকেতের বার সংখ্যার চেয়ে বেশি হয় তখন একটি বিক্রয় সংকেত দেওয়া হয়
- such কৌশলটি মূলত একটি দ্বি-অবধানে বিপরীতমুখী কৌশল, যা দ্রুত গড় এবং ধীর গড় বিপরীতমুখী দ্বারা প্রবণতা বিপরীতমুখী পয়েন্ট নির্ধারণ করে
কৌশলগত সুবিধা
- ডাবল ইক্যুইটি বিচার ব্যবহার করে, আংশিক গোলমাল ট্রেডিং সংকেতগুলি ফিল্টার করা হয়েছে
- বার্সিন্সের তুলনা বাড়ানো হয়েছে যাতে ফাল্টোফ্রাকশন এবং ক্লোজের মূল্যের বিপরীতমুখী ভুল সংকেত এড়ানো যায়
- সহজে বোঝা যায় এবং বাস্তবায়ন করা যায়
- বিভিন্ন সময়কাল এবং বাজারের জন্য কাস্টমাইজযোগ্য চলমান গড় প্যারামিটার
কৌশলগত ঝুঁকি
- ডাবল ইক্যুইটি স্ট্র্যাটেজি সহজেই বেশি সংকেত তৈরি করে, এবং ট্রেডিং ঘন হয়
- চলমান গড় প্যারামিটার ভুলভাবে সেট করলে দীর্ঘ ট্রেন্ডের সুযোগ মিস করা যেতে পারে
- দীর্ঘমেয়াদী গড়ের ব্রেকডাউন করার সময়, স্টপ ব্রেকিং পয়েন্টটি অনেক দূরে থাকতে পারে এবং একটি বড় প্রত্যাহার রয়েছে
- স্পাইরেল বাজারকে ফিল্টার করতে ব্যর্থ
কৌশল অপ্টিমাইজেশনের দিকনির্দেশনা
- অন্যান্য সূচকগুলিকে ফিল্টার করা হয়েছে যাতে ভূমিকম্পে আটকে না পড়ে
- ক্ষতিপূরণ বাড়ানো
- চলমান গড়রেখার প্যারামিটার সমন্বয় অপ্টিমাইজ করুন
- চলমান গড় প্যারামিটারগুলি বাজারের চক্রের গতিশীলতার সাথে সামঞ্জস্যপূর্ণ
সারসংক্ষেপ
এই কৌশলটি সামগ্রিকভাবে যুক্তিযুক্ত এবং সহজেই বোঝা যায়, দ্রুত গড় এবং ধীর গড় রেখার বিপরীতের মাধ্যমে বাজারের প্রবণতা টার্নপয়েন্টগুলি নির্ধারণ করে, তাত্ত্বিকভাবে প্রবণতা কার্যকরভাবে অনুসরণ করতে পারে। তবে বাস্তবে প্রয়োগের জন্য কৌশল অ্যালগরিদম নিজেই এবং প্যারামিটার সেটিংয়ের জন্য অপ্টিমাইজ করা প্রয়োজন, যাতে এটি আরও স্থিতিশীল এবং বাস্তবসম্মত হয়।
Source
Pine
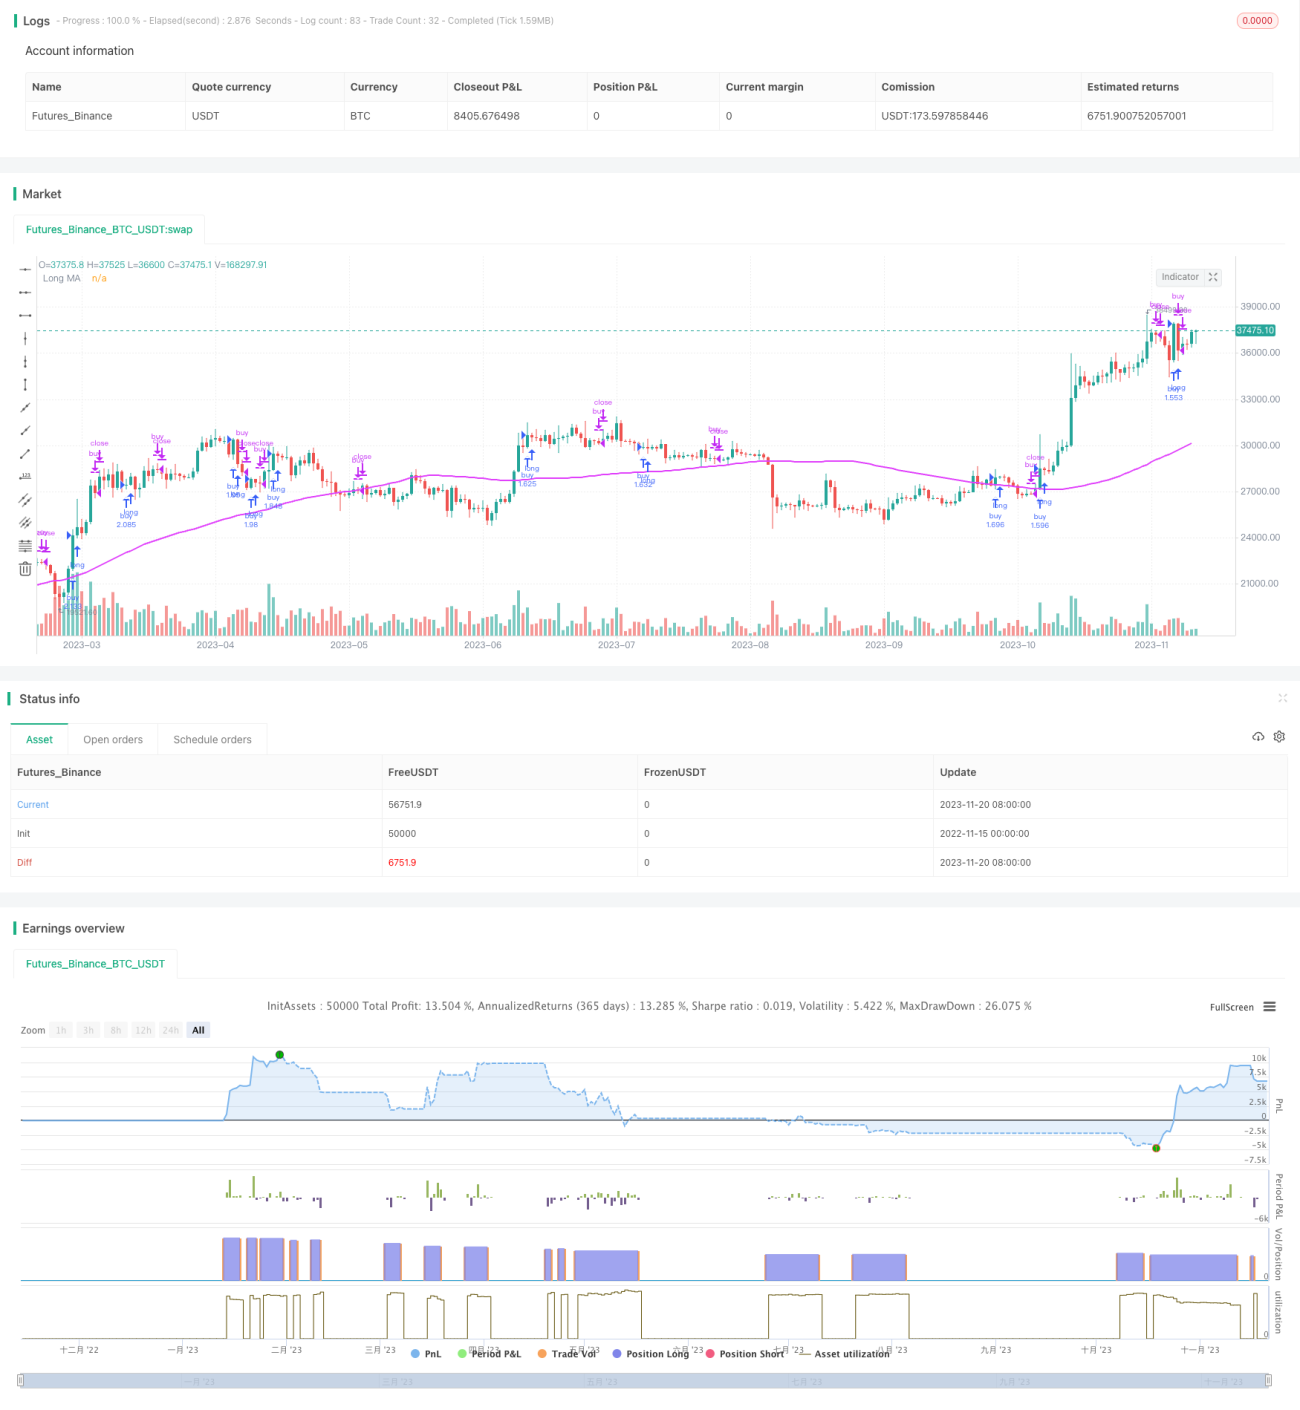
/*backtest
start: 2022-11-15 00:00:00
end: 2023-11-21 00:00:00
period: 1d
basePeriod: 1h
exchanges: [{"eid":"Futures_Binance","currency":"BTC_USDT"}]
*/

//@version=3
strategy("Up Down", "Up Down", precision = 6, pyramiding = 1, default_qty_type = strategy.percent_of_equity, default_qty_value = 99, commission_type = strategy.commission.percent, commission_value = 0.0, initial_capital = 1000, overlay = true)

buy = close > open and open > close[1]Strategy parameters
Related strategies
Comment
All comments (0)
No data
- 1