বলিঙ্গার ব্যান্ড-ভিত্তিক স্বল্পমেয়াদী ট্রেন্ড ট্র্যাকিং কৌশল

ওভারভিউ
বুলিং-ব্রেকিং কৌশলটি একটি বুলিং-ব্রেকিং সূচকের উপর ভিত্তি করে একটি স্বল্পমেয়াদী প্রবণতা-অনুসরণকারী কৌশল। এটি একাধিক এবং শূন্যপদ উভয় দিকের অপারেশন সম্পাদন করতে পারে। এটি নগদ এবং স্থায়ী চুক্তির জন্য প্রযোজ্য, বিশেষত প্রবণতার ক্ষেত্রে।
এই কৌশলটি অত্যন্ত কনফিগারযোগ্য, যা ব্যবহারকারীকে ব্রেন্ডের প্যারামিটার সময়কাল এবং বিচ্যুতি, প্রবণতা ফিল্টার, অস্থিরতা ফিল্টার, লেনদেনের দিকনির্দেশ ফিল্টার, পরিবর্তন হার ফিল্টার এবং তারিখ ফিল্টার ইত্যাদি সেট করতে দেয়। উপরন্তু, এটি মাল্টি-হেড এবং খালি-হেড পজিশনের জন্য স্টপ লস, স্টপ লস এবং ট্র্যাকিং স্টপ লস সেট করে, যা একটি বিস্তৃত ঝুঁকি ব্যবস্থাপনার পদ্ধতি নিশ্চিত করে। প্রতিদিনের সর্বাধিক ক্ষতির সাথে যুক্ত হওয়া আরও একটি স্তর সুরক্ষা সরবরাহ করে, এটি একটি নির্ভরযোগ্য পেশাদার স্ব-অনুশীলিত ট্রেডিং সিস্টেম করে।
কৌশল নীতি
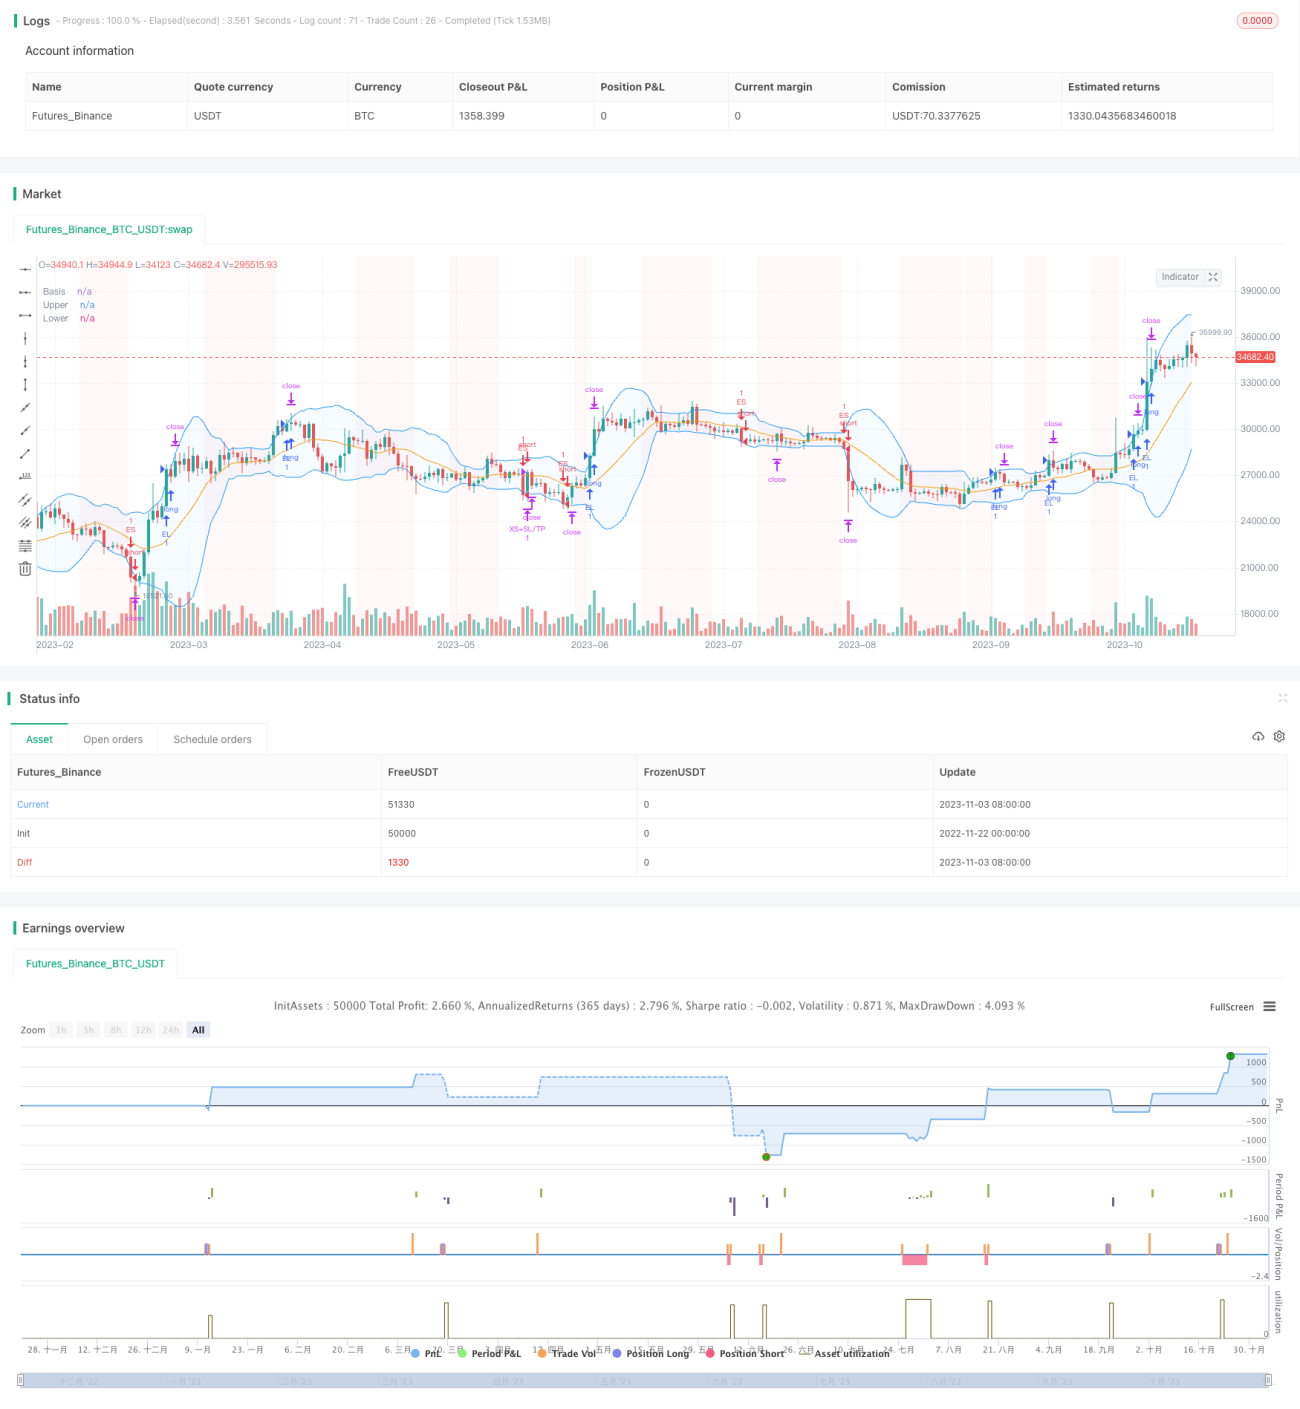
এই কৌশলটির কেন্দ্রীয় সূচক হ'ল বুলিন ব্যান্ড। বুলিন ব্যান্ডটি মধ্যম, উপরের এবং নীচের ট্র্যাকের তিনটি রেখার সমন্বয়ে গঠিত, যা দামের গড় রেখা, ওঠানামা এবং ওঠানামার নীচের সীমাকে উপস্থাপন করে। যখন দাম উর্ধ্বমুখী হয়, তখন বেশি করুন; যখন দাম নীচের দিকে যায়, তখন খালি করুন।
নয়েজ লেনদেন এড়ানোর জন্য নীতিটি বেশ কয়েকটি সহায়ক ফিল্টারও সেট করেছে। এই ফিল্টারগুলির মধ্যে রয়েছেঃ
-
প্রবণতা ফিল্টারঃ মুভিং এভারেজের উপরে দাম বেশি, মুভিং এভারেজের নিচে দাম কম;
-
অস্থিরতা ফিল্টারঃ শুধুমাত্র যখন অস্থিরতা বৃদ্ধি পায় তখনই ট্রেড করুন;
-
ট্রেডিং দিকনির্দেশনা ফিল্টারঃ ট্রেডিং-এ-অধিক, ট্রেডিং-এ-খুব কম বা দ্বি-মুখী ট্রেডিংয়ের বিকল্পগুলি চিহ্নিতকরণের বৈশিষ্ট্য অনুসারে;
-
পরিবর্তনের হার ফিল্টারঃ যখন পূর্ববর্তী ট্রেডিং দিনের শেষের দামের তুলনায় দামের পরিবর্তনের হার একটি নির্দিষ্ট স্তরে পৌঁছে যায় তখনই প্রবেশ করা হয়;
-
তারিখ ফিল্টারঃ পুনরুদ্ধারের সময়সীমা সেট করুন।
সমস্ত ফিল্টার শর্ত পূরণ হলে ট্রেডিং সিগন্যাল উৎপন্ন করা হয়। স্টপ, স্টপ লস এবং ট্র্যাকিং স্টপ লস ঝুঁকি ব্যবস্থাপনা নিশ্চিত করে। এছাড়াও, সর্বোচ্চ দৈনিক ক্ষতির সেটিংটি এক দিনের মধ্যে ব্যাপক প্রত্যাহার এড়াতে পারে।
সামর্থ্য বিশ্লেষণ
এই কৌশলটির সুবিধাগুলো হলঃ
-
এই প্রাপ্তবয়স্ক সূচকটি ব্রিন ব্যান্ডকে কেন্দ্রীয় ট্রেডিং সিগন্যাল হিসেবে ব্যবহার করে, যা অত্যন্ত নির্ভরযোগ্য।
-
মাল্টি-ফিল্টার ডিজাইনটি ভুল লেনদেন এড়াতে এবং কনফিগারযোগ্য;
-
স্টপ, স্টপ লস এবং ট্র্যাকিং স্টপ লস ব্যাপক এবং নমনীয়;
-
সর্বোচ্চ দৈনিক ক্ষতি সেট করুন কার্যকর নিয়ন্ত্রণ ওয়ান ডে প্রত্যাহার <unk>
-
ট্রেন্ডিং মার্কেটের জন্য উপযুক্ত, লাভের সম্ভাবনা অনেক বেশি।
ঝুঁকি বিশ্লেষণ
এই কৌশলটি কিছু ঝুঁকি নিয়েও এসেছেঃ
-
ব্রিন ব্রেন্ডের ব্রেকডাউনগুলি মাথা এবং নীচের ব্রেকডাউনগুলির জন্য সহজ, যা ক্ষতির কারণ হতে পারে;
-
মার্কেটে, ফিল্টারগুলি খুব কঠোর হতে পারে এবং ট্রেডিংয়ের সুযোগগুলি মিস করতে পারে।
-
বড় ধরনের উড়োজাহাজের ক্ষতি হতে পারে, যা সরাসরি স্টপ লিনিয়ার অতিক্রম করতে পারে;
-
এই ধরনের পরিস্থিতিতে, বিপুল পরিমাণ ক্ষতি সম্পূর্ণরূপে এড়ানো সম্ভব নয়।
উপরোক্ত ঝুঁকির জন্য, ফিল্টারিংয়ের শর্তগুলি যথাযথভাবে শিথিল করা যেতে পারে, বা কিছু পজিশন বন্ধ করতে, স্টপ লস দূরত্ব হ্রাস করতে ইত্যাদি হস্তক্ষেপ করা যেতে পারে।
অপ্টিমাইজেশান দিক
এই কৌশলটি নিম্নলিখিত দিকগুলি থেকে অপ্টিমাইজ করা যেতে পারেঃ
-
বিভিন্ন প্যারামিটার সমন্বয় চেষ্টা করুন এবং সর্বোত্তম প্যারামিটার ব্যাপ্তি খুঁজুন।
-
মেশিন লার্নিং মডেল যুক্ত করা, প্যারামিটারগুলির গতিশীল অপ্টিমাইজেশন করা;
-
সময় ও ভোল্টেজ ক্ষতির মতো আরও কার্যকর পদ্ধতির উপর গবেষণা করা;
-
তিনি বলেন, "এটি এমন একটি বিষয় যে, আমরা আমাদের দেশের জনগণের জন্য কিছু করতে পারি।
-
পরিসংখ্যানগত অ্যারেটেজ, সংশ্লিষ্ট পণ্যের সাথে মিলিত।
সারসংক্ষেপ
বুলিন ব্রেড ব্রেকিং কৌশলটি একটি পরিপক্ক এবং নির্ভরযোগ্য সংক্ষিপ্ত লাইন ট্রেন্ড অনুসরণ কৌশল। এটি বুলিন ব্রেড সূচককে সংকেত হিসাবে গ্রহণ করে এবং একাধিক ফিল্টার সেট করে যা সংকেতের নির্ভরযোগ্যতা নিশ্চিত করে। একই সাথে, একটি বিস্তৃত স্টপ লস এবং ঝুঁকি নিয়ন্ত্রণ ব্যবস্থা ঝুঁকি নিয়ন্ত্রণ করে। এই কৌশলটি সক্রিয় ট্রেন্ডিং বাজারের জন্য উপযুক্ত, ভাল আয় সম্ভাবনা রয়েছে। ক্রমাগত অপ্টিমাইজেশনের মাধ্যমে, এটি একটি শক্তিশালী পরিমাণযুক্ত ট্রেডিং সিস্টেম হওয়ার সম্ভাবনা রয়েছে।
- 1