বলিঙ্গার ব্যান্ডস শতাংশ সূচকের উপর ভিত্তি করে হ্রাসকারী কৌশল

1
Follow
1779
Followers
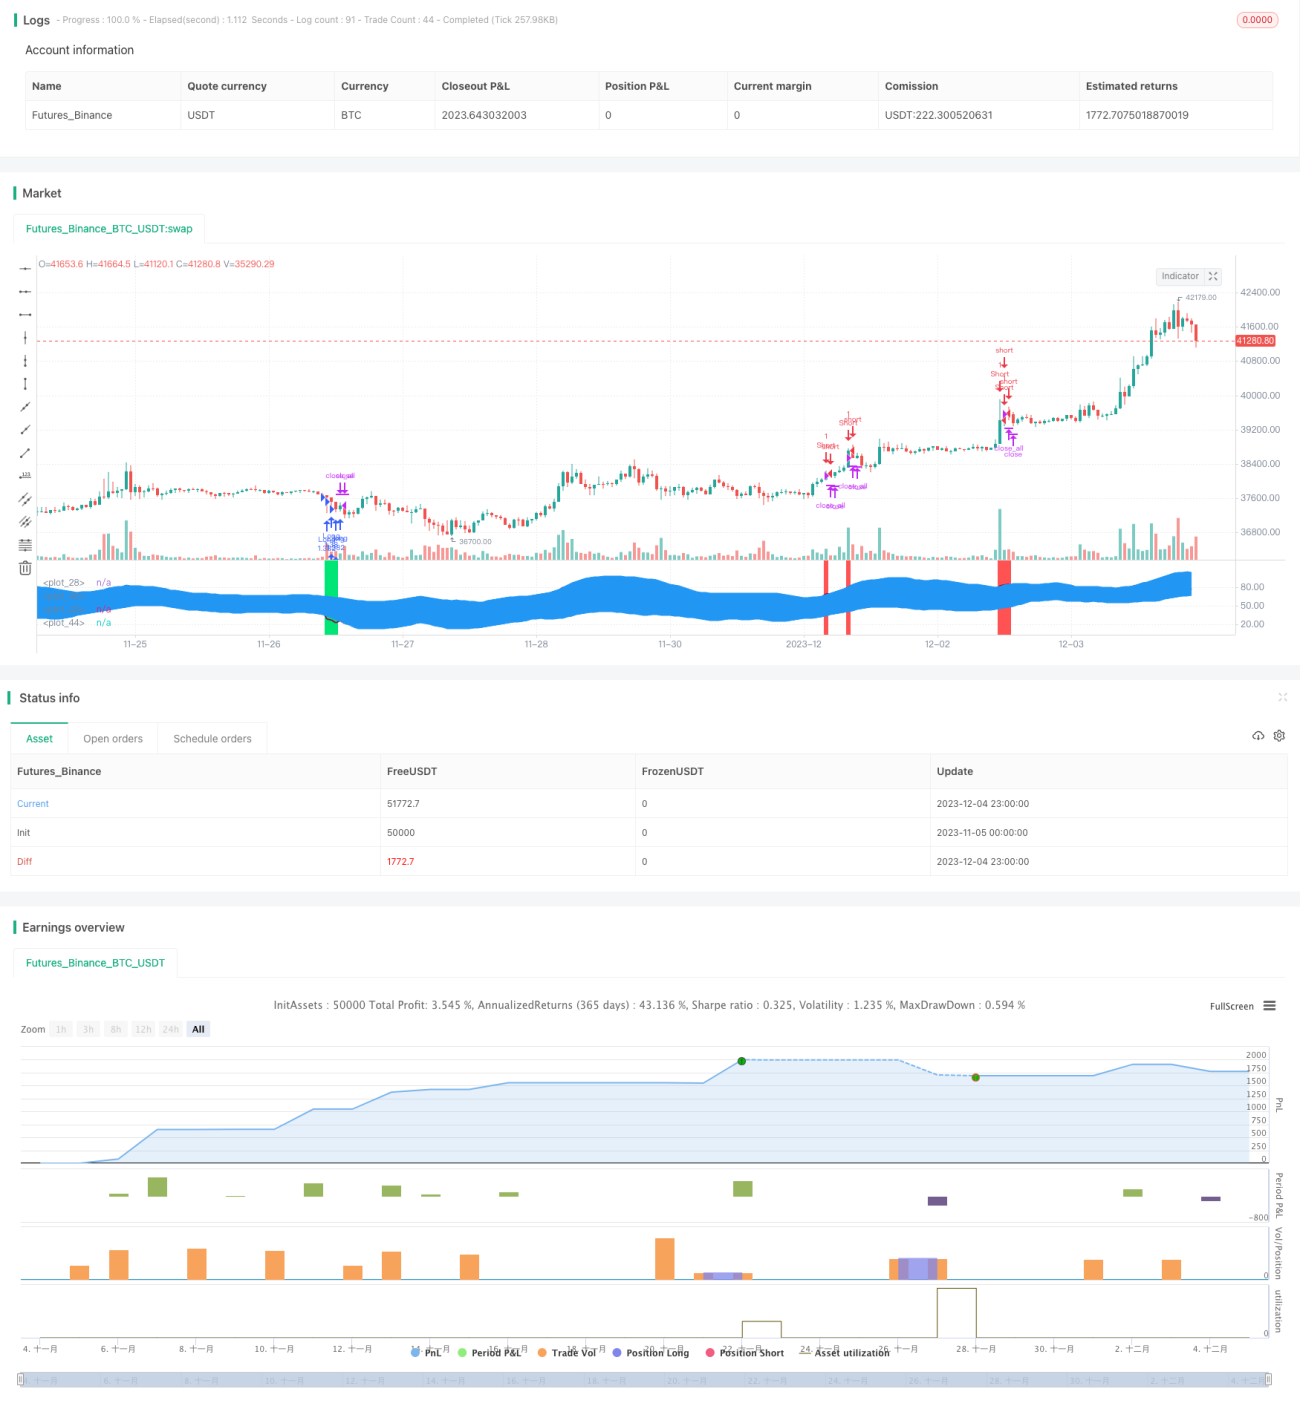
ওভারভিউ
এই কৌশলটি RSI এবং MFI সূচকগুলির সাথে সংযুক্ত ব্রিন ব্যান্ড শতাংশ সূচকের উপর ভিত্তি করে, আর্থিক পণ্যের দামগুলিকে ব্রিন ব্যান্ডটি ভেঙে ফেলার জন্য নিচে নেমে যাওয়ার জন্য, RSI ওভারসোল ওভারসোল ও MFI ওভারসোল ওভারসোল সংকেতগুলির সাথে সংযুক্ত করে, এবং আরও বেশি ডিফ্রাক্সিং সিদ্ধান্ত গ্রহণের জন্য। এটি একটি সাধারণ ট্রেন্ড ট্রেডিং কৌশল।
কৌশল নীতি
- বুলিন বন্ডের শতাংশ গণনা করুন (BB%) । বিবি% হল দামের তুলনায় বুলিন বন্ডের মধ্যম রেখার স্ট্যান্ডার্ড ডিফারেনশিয়াল, যা বুলিন বন্ডের মাধ্যমে বাজার দিকনির্দেশের বিচার করে।
- আরএসআই এবং এমএফআই সূচকগুলির সংমিশ্রণে ওভারবয় ওভারসোল নির্ধারণ করুন। আরএসআই ওভারবয় ওভারসোল নির্ধারণ করে, একটি নির্দিষ্ট সময়ের মধ্যে গড় উত্থান এবং গড় পতন তুলনা করে। এমএফআই ওভারবয় ওভারসোল নির্ধারণ করে, লেনদেনের পরিমাণ এবং লেনদেনের পরিমাণের তুলনা করে।
- যখন দাম নীচে থেকে নীচের দিকে বিউরিন ব্যান্ডের নীচের ট্র্যাকটি ভেঙে দেয়, তখন অতিরিক্ত করুন; যখন দাম উপরে থেকে নীচে থেকে বিউরিন ব্যান্ডের নীচের ট্র্যাকটি ভেঙে দেয়, তখন খালি করুন। একই সাথে আরএসআই এবং এমএফআই সূচকগুলির সাথে মিলিত ওভারসেল ওভারবই সংকেতগুলি ফিল্টার করুন।
কৌশলগত সুবিধা
- ট্রেন্ড ট্রেডিং, বাজারকে এড়িয়ে চলা, আয় কমিয়ে আনা।
- সিদ্ধান্ত গ্রহণের সঠিকতা বাড়ানোর জন্য একাধিক সূচক ফিল্টারিং সংকেত একত্রিত করুন।
- প্যারামেটরাইজড সেটিং নমনীয়, কৌশল ঝুঁকি উপার্জন বৈশিষ্ট্য সমন্বয়যোগ্য <unk>
- এই সূচকটি পণ্যদ্রব্য, বৈদেশিক মুদ্রা এবং ক্রিপ্টোকারেন্সি ইত্যাদির জন্য প্রযোজ্য।
ঝুঁকি ও সমাধান
- বুলিন বন্ডের বিভাজনের ফলে একটি মিথ্যা সংকেত তৈরি হওয়ার সম্ভাবনা বেশি, যার জন্য একাধিক সূচকের সংমিশ্রণ ফিল্টার করা প্রয়োজন।
- "বিভ্রান্তি চিহ্নের বিচার করার জন্য উপযুক্ত স্বাচ্ছন্দ্যের প্রয়োজন, যাতে সুবর্ণ সুযোগগুলো হাতছাড়া না হয়"।
- প্যারামিটার সেটিং নিয়ন্ত্রণ ঝুঁকি, যেমন পজিশনের আকার পরিবর্তন করা, স্টপ লিনার বাড়ানো ইত্যাদি।
অপ্টিমাইজেশান দিক
- এটিআর সূচকের মতো ওঠানামার উপর ভিত্তি করে ক্ষতির ব্যবস্থা যোগ করা হয়েছে।
- মেশিন লার্নিং মডেলের প্রবর্তন করা হয়েছে যা ব্রেকথ্রু সিগন্যালের গুণমান নির্ধারণে সহায়তা করে।
- অংশগ্রহণকারী জাত নির্বাচন পদ্ধতির অপ্টিমাইজেশান, অংশগ্রহণকারী মানদণ্ডের গতিশীল সমন্বয়।
- এই পদ্ধতিতে সিদ্ধান্ত গ্রহণের পদ্ধতিকে আরও উন্নত করা যায়, যার মধ্যে রয়েছে আবেগের সূচক, সংবাদপত্রের চেহারা ইত্যাদি।
সারসংক্ষেপ
এই কৌশলটি মূলত উচ্চ ওঠানামার অ-প্রবণতাযুক্ত জাতের জন্য প্রয়োগ করা হয়, ব্রিনের বেন্ড চ্যানেল এবং সূচক সমন্বয় দ্বারা বিচার করে, ট্রেডিংয়ের প্রবণতা অর্জনের জন্য। প্যারামিটারগুলি সামঞ্জস্য করে ঝুঁকি-লাভের বৈশিষ্ট্যগুলি নিয়ন্ত্রণ করা যায়। পরবর্তীকালে আরও সহায়ক সূচক এবং মডেলগুলি সিদ্ধান্তের গুণমানকে অনুকূলিত করার জন্য প্রবর্তিত হতে পারে, যার ফলে আরও ভাল কৌশলগত পারফরম্যান্স পাওয়া যায়।
Source
Pine
Strategy parameters
Related strategies
Comment
All comments (0)
No data
- 1