
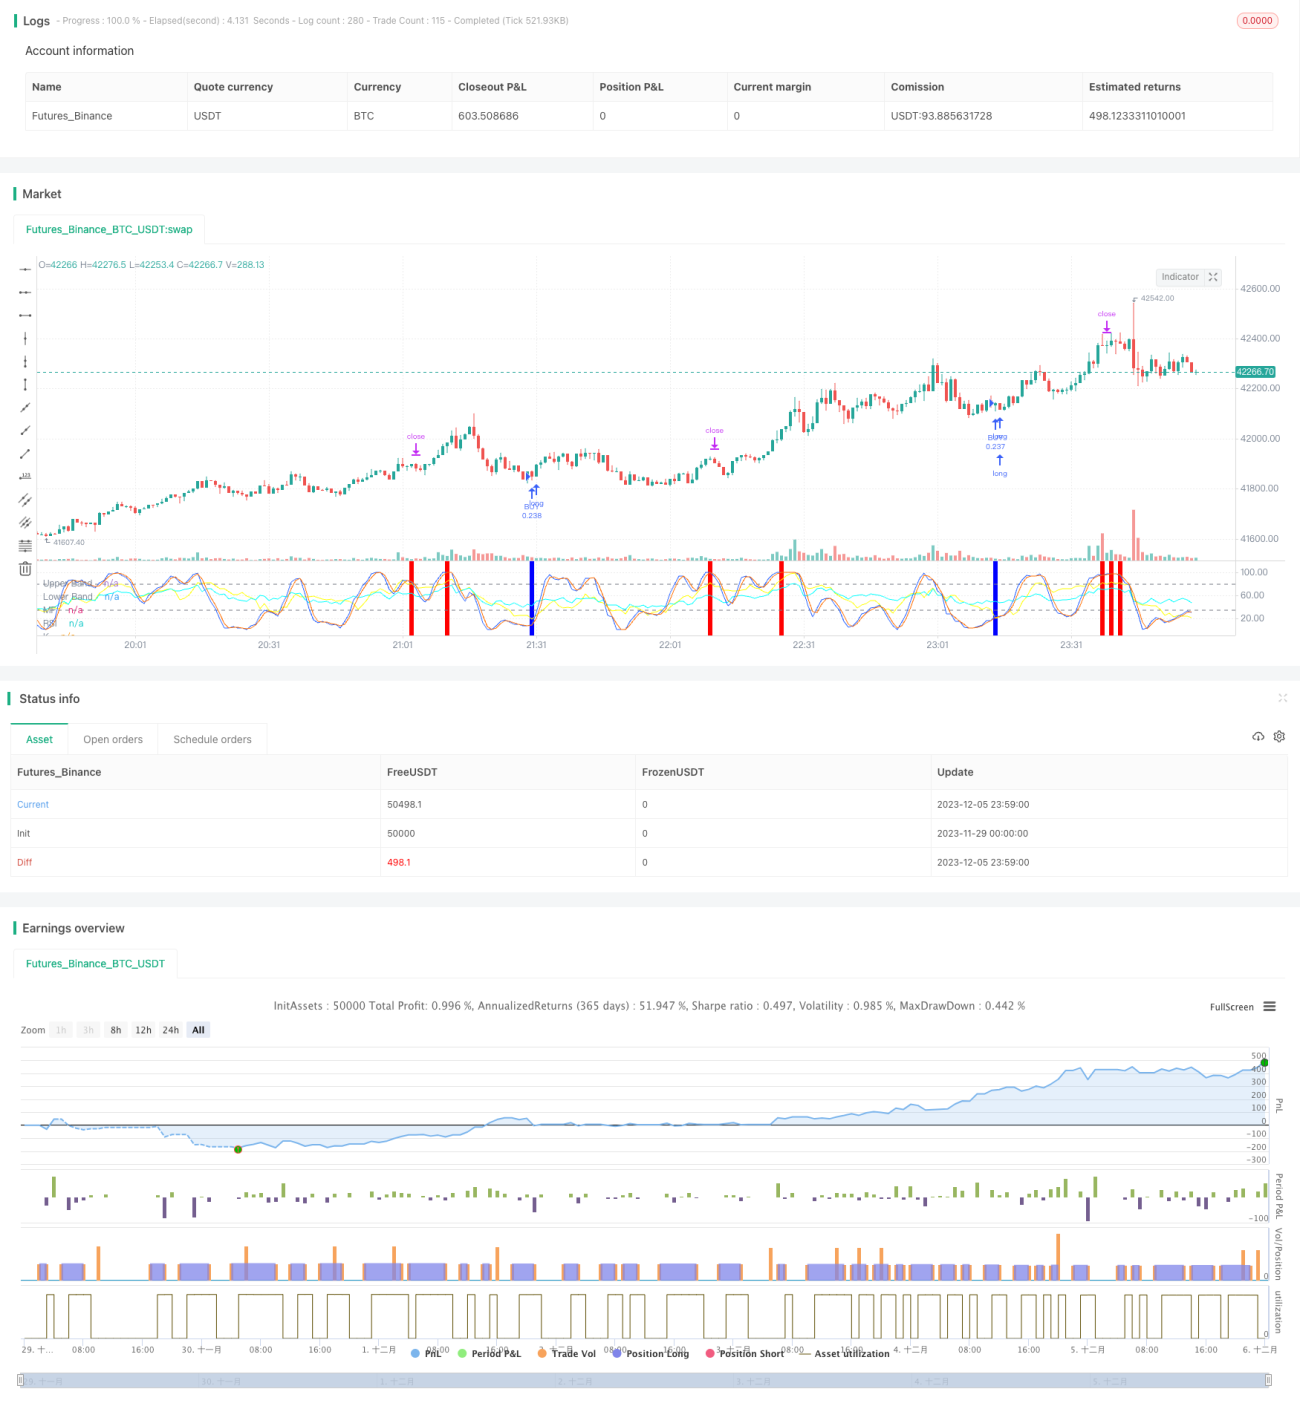
এই কৌশলটি আরএসআই, এমএফআই, স্টচ আরএসআই এবং এমএসিডি এর চারটি সূচককে একত্রিত করে বিটকয়েনের দিনের ব্যবসায়ের জন্য। যখন একাধিক সূচক একই সাথে কেনা বা বিক্রি করার সংকেত দেয়, তখন কৌশলটি ঝুঁকি নিয়ন্ত্রণের জন্য অর্ডার দেয়।
RSI সূচকটি বাজারকে ওভার-বই ওভার-সেল করার জন্য ব্যবহার করা হয়। RSI 40 এর নীচে একটি ক্রয় সংকেত দেয় এবং 70 এর উপরে একটি বিক্রয় সংকেত দেয়।
এমএফআই সূচক বাজারের তহবিল প্রবাহের বিচার করে। এমএফআই ২৩ এর নীচে ক্রয় সংকেত দেয় এবং ৮০ এর উপরে বিক্রয় সংকেত দেয়।
Stoch RSI সূচকটি বাজারটি ওভার-বই ওভার-সেল করছে কিনা তা নির্ধারণ করে। কে লাইনটি 34 এর নীচে একটি কেনার সংকেত দেয় এবং 80 এর উপরে একটি বিক্রয় সংকেত দেয়।
MACD সূচকটি বাজারের প্রবণতা এবং গতিশীলতা নির্ধারণ করে। দ্রুত লাইনটি ধীর লাইনের চেয়ে কম এবং পিলারটি নেতিবাচক হলে এটি একটি কেনার সংকেত দেয় এবং বিপরীতে এটি একটি বিক্রয় সংকেত দেয়।
চারটি সূচককে একত্রিত করে সংকেতের নির্ভুলতা বাড়ানো এবং একক সূচকের ব্যর্থতার কারণে ক্ষতি এড়ানো।
শুধুমাত্র যখন একাধিক সূচক একই সময়ে সংকেত দেয় তখনই অর্ডার করা হয়, যা মিথ্যা সংকেতের সম্ভাবনাকে উল্লেখযোগ্যভাবে হ্রাস করে।
রাতারাতি ঝুঁকি এড়াতে এবং আপনার মূলধন খরচ কমাতে, একটি দিনের ব্যবসায়িক কৌশল অবলম্বন করুন।
কৌশলগত লেনদেনের ফ্রিকোয়েন্সি কম হতে পারে, নির্দিষ্ট সময়ের ঝুঁকি রয়েছে। সূচক প্যারামিটারগুলি যথাযথভাবে শিথিল করা যেতে পারে, লেনদেনের সংখ্যা বাড়ানো যেতে পারে।
ইন্ডিকেটর থেকে ভুল সংকেত প্রেরণের সম্ভাবনা এখনও বিদ্যমান রয়েছে। মেশিন লার্নিং অ্যালগরিদম প্রবর্তন করা যেতে পারে যা ইন্ডিকেটর সংকেতের নির্ভরযোগ্যতা বিচার করতে সহায়তা করে।
কিছু ওভারবয় ওভারসোল্ড ঝুঁকি রয়েছে। সূচক প্যারামিটারগুলি যথাযথভাবে সামঞ্জস্য করা বা অন্যান্য সূচক বিচার লজিক যুক্ত করা যেতে পারে।
ইন্ডিকেটর প্যারামিটারের স্বনির্ধারিত বৈশিষ্ট্য যুক্ত করা হয়েছে। বাজার ওঠানামা এবং পরিবর্তনের গতির উপর ভিত্তি করে ইন্ডিকেটর প্যারামিটারের রিয়েল-টাইম সূক্ষ্ম-নির্ধারণ।
স্টপ লস লজিক যোগ করা হয়েছে। যদি ক্ষতির পরিমাণ একটি নির্দিষ্ট অনুপাত অতিক্রম করে তবে ক্ষতি বন্ধ হয়ে যায়, কার্যকরভাবে একক ক্ষতি নিয়ন্ত্রণ করা যায়।
অনুভূতি সূচকগুলির সাথে মিলিতঃ বাজার উত্তেজনা, বাজার আতঙ্কের মাত্রা ইত্যাদির মতো বহু-মাত্রিক বিচার, কৌশলগত মুনাফার স্থান বাড়ায়।
এই কৌশলটি চারটি প্রধান সূচকের মধ্যে পারস্পরিক যাচাইকরণের মাধ্যমে সংকেত প্রেরণ করে, যা মিথ্যা সংকেত হারকে কার্যকরভাবে হ্রাস করতে পারে। এটি একটি তুলনামূলকভাবে স্থিতিশীল উচ্চ-ফ্রিকোয়েন্সি লাভজনক কৌশল। প্যারামিটার এবং মডেলের ক্রমাগত অপ্টিমাইজেশনের সাথে সাথে কৌশলটির বিজয় এবং লাভজনকতা আরও বাড়ার সম্ভাবনা রয়েছে।
/*backtest
start: 2023-11-29 00:00:00
end: 2023-12-06 00:00:00
period: 1m
basePeriod: 1m
exchanges: [{"eid":"Futures_Binance","currency":"BTC_USDT"}]
*/
//@version=5
strategy('John Day Stop Loss', overlay=false, pyramiding=1, default_qty_type=strategy.cash, default_qty_value=10000, initial_capital=10000, currency='USD', precision=2)
strategy.risk.allow_entry_in(strategy.direction.long)
from_day = input.int(defval=1, title='From Day', minval=1)
from_month = input.int(defval=1, title='From Month', minval=1)
from_year = input.int(defval=2021, title='From Year', minval=2020)
to_day = input.int(defval=1, title='To Day', minval=1)
to_month = input.int(defval=1, title='To Month', minval=1)
to_year = input.int(defval=2025, title='To Year', minval=2020)
time_cond = time > timestamp(from_year, from_month, from_day, 00, 00) and time < timestamp(to_year, to_month, to_day, 00, 00)
//time_cond = true
//Stop Loss
longProfitPerc = input.float(title="Stop Loss Profit (%)", defval=2.1) / 100
longExitPrice = strategy.position_avg_price * (1 - longProfitPerc)
//RSI - yellow
up = ta.rma(math.max(ta.change(close), 0), 14)
down = ta.rma(-math.min(ta.change(close), 0), 14)
rsi = down == 0 ? 100 : up == 0 ? 0 : 100 - (100 / (1 + up / down))
plot(rsi, "RSI", color=#00FFFF)
buy_rsi = true // rsi < 40
sell_rsi = true //rsi > 70
//MFI - cyan
mf = ta.mfi(hlc3, 14)
plot(mf, "MF", color=#FFFF00)
buy_mfi = mf < input.int(defval=23, title='Max MF', minval=1)
sell_mfi = mf > input.int(defval=80, title='Min MF', minval=1)
//Stoch RSI
OverBought_StochRSI = input(80)
OverSold_StochRSI = input(34)
smoothK = input.int(3, "K", minval=1)
smoothD = input.int(2, "D", minval=1)
lengthRSI = input.int(14, "RSI Length", minval=1)
lengthStoch = input.int(14, "Stochastic Length", minval=1)
srcRSI = input(close, title="RSI Source")
rsi1 = ta.rsi(srcRSI, lengthRSI)
kStochRSI = ta.sma(ta.stoch(rsi1, rsi1, rsi1, lengthStoch), smoothK)
d = ta.sma(kStochRSI, smoothD)
co = ta.crossover(kStochRSI,d)
cu = ta.crossunder(kStochRSI,d)
buy_stochRSI = co and kStochRSI < OverSold_StochRSI
sell_stochRSI = cu and kStochRSI > OverBought_StochRSI
plot(kStochRSI, "K", color=#2962FF)
plot(d, "D", color=#FF6D00)
h0 = hline(OverBought_StochRSI, "Upper Band", color=#787B86)
h1 = hline(OverSold_StochRSI, "Lower Band", color=#787B86)
fill(h0, h1, color=color.rgb(33, 150, 243, 90), title="Background")
//MACD
// Getting inputs
fast_length = input(title="Fast Length", defval=12)
slow_length = input(title="Slow Length", defval=26)
src = input(title="Source", defval=close)
signal_length = input.int(title="Signal Smoothing", minval = 1, maxval = 50, defval = 9)
sma_source = input.string(title="Oscillator MA Type", defval="EMA", options=["SMA", "EMA"])
sma_signal = input.string(title="Signal Line MA Type", defval="EMA", options=["SMA", "EMA"])
// Plot colors
//col_macd = input(#2962FF, "MACD Line ", group="Color Settings", inline="MACD")
//col_signal = input(#FF6D00, "Signal Line ", group="Color Settings", inline="Signal")
//col_grow_above = input(#26A69A, "Above Grow", group="Histogram", inline="Above")
//col_fall_above = input(#B2DFDB, "Fall", group="Histogram", inline="Above")
//col_grow_below = input(#FFCDD2, "Below Grow", group="Histogram", inline="Below")
//col_fall_below = input(#FF5252, "Fall", group="Histogram", inline="Below")
// Calculating
fast_ma = sma_source == "SMA" ? ta.sma(src, fast_length) : ta.ema(src, fast_length)
slow_ma = sma_source == "SMA" ? ta.sma(src, slow_length) : ta.ema(src, slow_length)
macd = fast_ma - slow_ma
signal = sma_signal == "SMA" ? ta.sma(macd, signal_length) : ta.ema(macd, signal_length)
hist = macd - signal
buy_MACD = macd < signal and hist < 0
sell_MACD = macd > signal and hist > 0
//buy_MACD = true
//sell_MACD = true
//plot(hist, title="Histogram", style=plot.style_columns, color=(hist>=0 ? (hist[1] < hist ? col_grow_above : col_fall_above) : (hist[1] < hist ? col_grow_below : col_fall_below)))
//plot(macd, title="MACD", color=col_macd)
//plot(signal, title="Signal", color=col_signal)
sessionColor = color(na)
if time_cond
if (not na(kStochRSI) and not na(d))
cmt = str.tostring(close)
if (buy_stochRSI and buy_MACD and buy_mfi and buy_rsi)
strategy.entry("BUY", strategy.long, comment='BUY @ ' + cmt)
if longProfitPerc != 0
strategy.exit(id="x", stop=longExitPrice, comment='EXIT @ ' + str.tostring(longExitPrice))
sessionColor := input.color(#0000FF, "buy") //red
if (sell_stochRSI and sell_MACD and sell_mfi and sell_rsi)
strategy.entry("SELL", strategy.short, comment='SELL @ ' + cmt)
sessionColor := input.color(#FF0000, "sell") //green
bgcolor(sessionColor)