
এটি হল ভারতের দিনের ব্যবসায়ের জন্য একটি মূল পয়েন্ট কৌশল, যা মূলত ওপেন, হাই, লো এবং ক্লোজিং মূল্য ব্যবহার করে মূল সমর্থন এবং প্রতিরোধের পয়েন্টগুলি গণনা করে এবং যখন এই পয়েন্টগুলিতে দামের ব্রেকআউট হয় তখন ট্রেড করে।
মূল কী পয়েন্ট গণনা সূত্রটি নিম্নরূপঃ
PP = (最高价+最低价+收盘价)/3
R1 = 2*PP - 最低价
S1 = 2*PP - 最高价
ঝুঁকি মোকাবিলার উপায়ঃ
এই কৌশলটি সামগ্রিকভাবে সহজ এবং সরাসরি, এবং historicalতিহাসিক তথ্যের মাধ্যমে কার্যকারিতা সহজেই যাচাই করা যায়। একটি intraday ট্রেডিং কৌশল হিসাবে, এটি মূল পয়েন্টগুলি ব্যবহার করে একটি উচ্চ সম্ভাব্যতা ব্রেকআউট সরবরাহ করে, যা ভাল ফলাফল অর্জন করতে পারে। তবে, মূল পয়েন্টগুলির উপর নির্ভরশীলতার কারণে, কিছু ভুয়া ব্রেকআউট ঝুঁকিও রয়েছে, যা আরও হ্রাস করার জন্য আরও অপ্টিমাইজ করা দরকার। সামগ্রিকভাবে, এটি একটি সহজেই বাস্তবায়িত, ঝুঁকি নিয়ন্ত্রণযোগ্য intraday ট্রেডিং কৌশল।
/*backtest
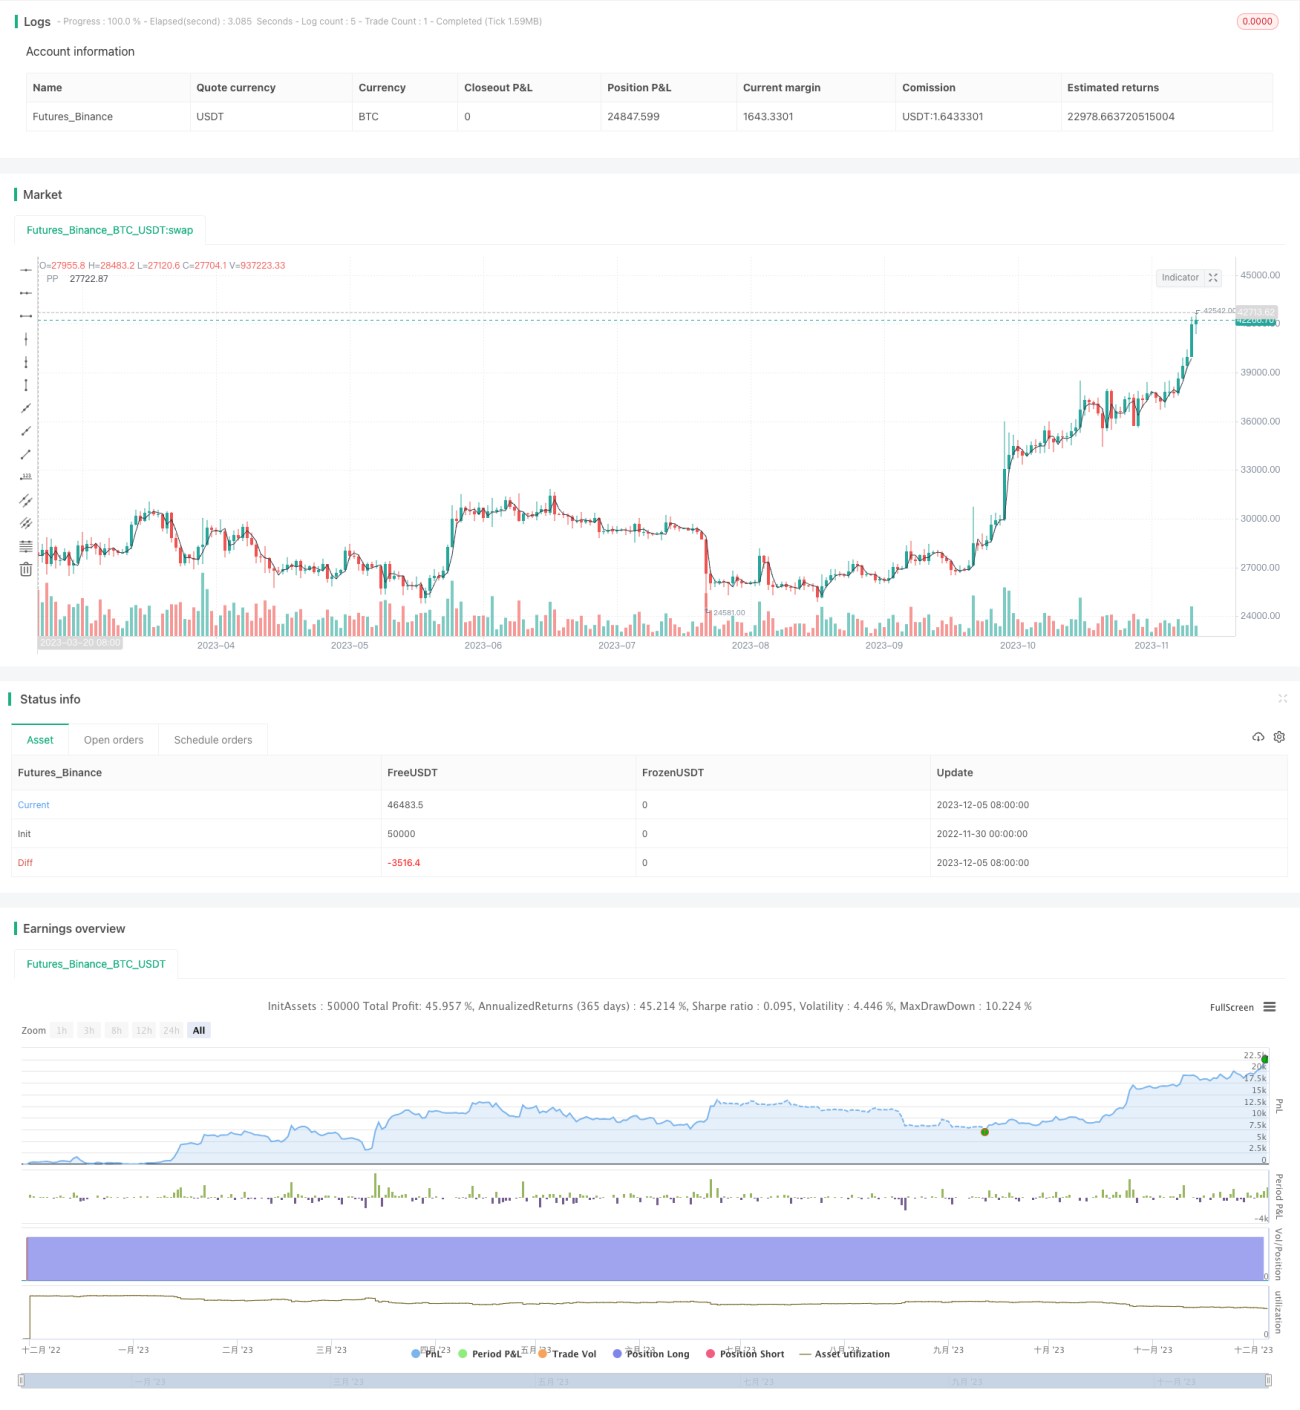
start: 2022-11-30 00:00:00
end: 2023-12-06 00:00:00
period: 1d
basePeriod: 1h
exchanges: [{"eid":"Futures_Binance","currency":"BTC_USDT"}]
*/
// This source code is subject to the terms of the Mozilla Public License 2.0 at https://mozilla.org/MPL/2.0/
// © arameshraju
//Reference credit goes to All
//@version=4
strategy("ARR-Pivote-India-Stategy",shorttitle="ARR-PP-Ind", overlay=true)
// This source code is subject to the terms of the Mozilla Public License 2.0 at https://mozilla.org/MPL/2.0/
// © arameshraju
//User Input
showPrevDayHighLow = input(false, title="Show previous day's High & Low(PDH/PDL)", type=input.bool)
showPivoteLine = input(true, title="Show Pivot Point(PP)", type=input.bool)
showPivoteR1Line = input(false, title="Show Pivot Point Resistance (R1)", type=input.bool)
showPivoteS1Line = input(false, title="Show Pivot Point Support (S1)", type=input.bool)
tradeLong = input(true, title="Trade on Long Entry", type=input.bool)
tradeShort = input(false, title="Trade on Short Entry", type=input.bool)
maxLoss = input(0.5, title="Max Loss on one Trade", type=input.float)
tradeOn=input(title="Trade base Level", type=input.string,
options=["PP", "PDH", "PDL","R1","S1"], defval="PP")
sessSpec = input("0915-1530", title="Session time", type=input.session)
// Defaults
// Colors
cColor = color.black
rColor = color.red
sColor = color.green
// Line style & Transparency
lStyle = plot.style_line
lTransp = 35
// Get High & Low
getSeries(_e, _timeFrame) => security(syminfo.tickerid, _timeFrame, _e, lookahead=barmerge.lookahead_on)
is_newbar(res, sess) =>
t = time(res, sess)
na(t[1]) and not na(t) or t[1] < t
newbar = is_newbar("375", sessSpec)
// Today's Session Start timestamp
y = year(timenow)
m = month(timenow)
d = dayofmonth(timenow)
// Start & End time for Today
start = timestamp(y, m, d, 09, 15)
end = start + 86400000
PrevDayHigh = getSeries(high[1], 'D')
PrevDayLow = getSeries(low[1], 'D')
PrevDayClose = getSeries(close[1], 'D')
PivoteLine=(PrevDayHigh+PrevDayLow+PrevDayClose) /3
PivoteR1=(PivoteLine*2) -PrevDayLow
PivoteS1=(PivoteLine*2) -PrevDayHigh
orbPrevDayOpen = getSeries(open[1], 'D')
orbPrevDayClose = getSeries(close[1], 'D')
// //Preview Day High line
// _pdh = line.new(start, PrevDayHigh, end, PrevDayHigh, xloc.bar_time, color=color.red, style=line.style_solid, width=2)
// line.delete(_pdh[1])
// _pdl = line.new(start, PrevDayLow, end, PrevDayLow, xloc.bar_time, color=color.green, style=line.style_solid, width=2)
// line.delete(_pdl[1])
// _Pp = line.new(start, PrevDayLow, end, PrevDayLow, xloc.bar_time, color=color.green, style=line.style_dashed, width=2)
// line.delete(_Pp[1])
// //Previous Day Low Line
// l_pdh = label.new(start, PrevDayHigh, text="PD", xloc=xloc.bar_time, textcolor=rColor, style=label.style_none)
// label.delete(l_pdh[1])
// l_pdl = label.new(start, PrevDayLow, text="PD", xloc=xloc.bar_time, textcolor=sColor, style=label.style_none)
// label.delete(l_pdl[1])
// //Pivote Line
// l_pp = label.new(start, PivoteLine, text="PP", xloc=xloc.bar_time, textcolor=color.black, style=label.style_none)
// label.delete(l_pp[1])
// l_R1 = label.new(start, PivoteR1, text="R1", xloc=xloc.bar_time, textcolor=color.fuchsia, style=label.style_none)
// label.delete(l_pp[1])
// l_SR = label.new(start, PivoteS1, text="S2", xloc=xloc.bar_time, textcolor=color.navy, style=label.style_none)
// label.delete(l_pp[1])
plot(showPrevDayHighLow?PrevDayHigh:na , title=' PDH', color=rColor)
plot(showPrevDayHighLow?PrevDayLow:na, title=' PDL', color=sColor)
plot(showPivoteLine?PivoteLine:na, title=' PP', color=color.black)
plot(showPivoteR1Line?PivoteR1:na, title=' R1', color=color.fuchsia)
plot(showPivoteS1Line?PivoteS1:na, title=' S1', color=color.navy)
// Today's Session Start timestamp
// Start & End time for Today
//endTime = timestamp(t, m, d, 15, 00)
tradeEventPrice= if string("PDH")==tradeOn
PrevDayHigh
else if string("PDL")==tradeOn
PrevDayLow
else if string("R1")==tradeOn
PivoteR1
else if string("S1")==tradeOn
PivoteS1
else
PivoteLine
//tradeEventPrice=PrevDayHigh
if (open < tradeEventPrice) and ( close >tradeEventPrice ) and ( hour < 13 ) and tradeLong
strategy.entry("buy", strategy.long, 1, when=strategy.position_size <= 0)
if (open > tradeEventPrice) and ( close <tradeEventPrice ) and ( hour < 13 ) and tradeShort
strategy.entry("Sell", strategy.short, 1, when=strategy.position_size <= 0)
mxloss=orbPrevDayClose*maxLoss
strategy.exit("exit", "buy", loss = mxloss)
strategy.exit("exit", "Sell", loss = mxloss)
strategy.close_all(when = hour == 15 , comment = "close all entries")