EMA এবং ATR স্টপ লস এর উপর ভিত্তি করে ট্রেন্ড ফলোয়িং কৌশল

ওভারভিউ
এই কৌশলটি EMA সমান্তরাল গোল্ডেন ক্রস ব্যবহার করে ট্রেডিং সিগন্যাল তৈরি করে, অর্থাৎ দ্রুত EMA লাইনে ধীর EMA লাইন অতিক্রম করার সময় একটি কেনার সংকেত তৈরি করে এবং দ্রুত EMA লাইনের নীচে ধীর EMA লাইন অতিক্রম করার সময় একটি বিক্রয় সংকেত তৈরি করে। এটি একটি সাধারণ প্রবণতা অনুসরণকারী কৌশল। একই সাথে, কৌশলটি ATR সূচক ব্যবহার করে গতিশীল স্টপ লস সেট করে এবং একই সাথে ঝুঁকি নিয়ন্ত্রণ করে।
কৌশল নীতি
- সংজ্ঞায়িত দ্রুত ইএমএ গড় সময়কাল 13 এবং ধীর ইএমএ গড় সময়কাল 48।
- যখন দ্রুত ইএমএ লাইনটি ধীর ইএমএ লাইনটি অতিক্রম করে, একটি কেনার সংকেত উত্পন্ন হয়; যখন দ্রুত ইএমএ লাইনটি ধীর ইএমএ লাইনটি অতিক্রম করে, একটি বিক্রয় সংকেত উত্পন্ন হয়।
- ta.crossover এবং ta.crossunder ফাংশন দ্বারা সমান্তরাল জালিয়াতি এবং মৃত জালিয়াতি বিচার করুন।
- এটিআর সূচক ব্যবহার করে গতিশীল স্টপ লস গণনা করা হয়, স্টপ লস দূরত্বের 1.5 গুণ এটিআর।
- রঙ পরিবর্তন, ক্রয়-বিক্রয় চিহ্ন এবং স্টপ লিনের মাধ্যমে ট্রেডিং সিগন্যাল এবং স্টপ লস দৃশ্যমান।
কৌশলগত শক্তি বিশ্লেষণ
- ইএমএ গড়ের উপর ভিত্তি করে গোল্ডেন ফর্কের ডাইফোর্ক সংকেত তৈরি করে, বাজারের প্রধান প্রবণতাগুলিকে মিস করা এড়াতে, আয় তুলনামূলকভাবে উল্লেখযোগ্য।
- এটিআর ডায়নামিক ট্র্যাকিং স্টপ লস, যা যথেষ্ট লাভজনকতা নিশ্চিত করে এবং প্রত্যাহারের ঝুঁকি নিয়ন্ত্রণ করে, সামগ্রিক ঝুঁকি-লাভের তুলনায় ভারসাম্য বজায় রাখে।
- স্বজ্ঞাত সিগন্যাল এবং স্টপলস ডিসপ্লে, সহজ অপারেশন, বেশিরভাগ মানুষের জন্য উপযুক্ত <unk>
- এটির জন্য কম প্যারামিটার রয়েছে যা সহজেই পরিচালনা এবং অপ্টিমাইজ করা যায়।
কৌশলগত ঝুঁকি বিশ্লেষণ
- হঠাৎ কোনো ঘটনা ঘটলে এই পতন ক্ষতির কারণ হতে পারে।
- ভূমিকম্পের সময় প্রায়ই অকার্যকর সংকেত দেখা দিতে পারে।
- প্যারামিটার সেট না করা হলে, মাঠে প্রবেশের জন্য অতিরিক্ত তীব্রতা বা স্টপ ক্ষতির জন্য অতিরিক্ত স্বাচ্ছন্দ্য দেখা দিতে পারে।
- EMA এবং ATR প্যারামিটারগুলি যথাযথভাবে অপ্টিমাইজ করা দরকার।
সমাধানঃ
- ATR গুণকটি যথাযথভাবে প্রশস্ত করা যেতে পারে যাতে স্টপডোজের নিকটতম উচ্চতার কিছু বাফারিং থাকে।
- সিগন্যালের পরে নিশ্চিতকরণ ব্যবস্থা বিবেচনা করা যেতে পারে, যেমন দামের উচ্চতা অতিক্রম করার আগে।
- প্যারামিটার অপ্টিমাইজেশনের জন্য, বিভিন্ন বাজারের পরিস্থিতি বিবেচনা করা উচিৎ।
কৌশল অপ্টিমাইজেশনের দিকনির্দেশনা
- বিভিন্ন প্যারামিটার সমন্বয় পরীক্ষা করে সেরা প্যারামিটার খুঁজে বের করা যায়।
- সিগন্যাল ফিল্টার করার জন্য অন্যান্য সূচক যেমন ট্র্যাফিক সূচক, ওঠানামা সূচক ইত্যাদি যোগ করার কথা বিবেচনা করা যেতে পারে।
- EMA প্যারামিটারগুলিকে বড় আকারের প্রবণতা অনুসারে সামঞ্জস্য করা যেতে পারে, যাতে প্রধান প্রবণতা আরও ভালভাবে ধরা যায়।
- এটিআর স্টপ মপলিফিক্টের গতিশীল সমন্বয় বিবেচনা করা যেতে পারে, প্রবণতা চলাকালীন স্টপ স্পেসের প্রসারিত করা যেতে পারে।
- মেশিন লার্নিং অ্যালগরিদমের সাথে মিলিত হতে পারে স্ব-অনুকূলিতকরণ অপ্টিমাইজেশান প্যারামিটার।
সারসংক্ষেপ
এই কৌশলটি সামগ্রিকভাবে সহজ এবং সহজেই ব্যবহারযোগ্য, ইএমএ-এর উপর ভিত্তি করে একটি সংকেত উত্পন্ন করে, এবং এটিআর সূচক দ্বারা ক্ষতির ট্র্যাকিংয়ের সাথে যুক্ত হয়, যা কার্যকরভাবে ঝুঁকি নিয়ন্ত্রণ করতে পারে। যদিও কিছু মিথ্যা সংকেত থাকবে, তবে মূল প্রবণতা ধরার ক্ষমতা শক্তিশালী, আয়টি স্থিতিশীল, এটি পরিমাণগত ব্যবসায়ের জন্য উপযুক্ত একটি মৌলিক কৌশল। প্যারামিটার অপ্টিমাইজেশন এবং বৈশিষ্ট্য সম্প্রসারণের মাধ্যমে এটির অনেক উন্নতির জায়গা রয়েছে, যা গভীরভাবে অধ্যয়নরত।
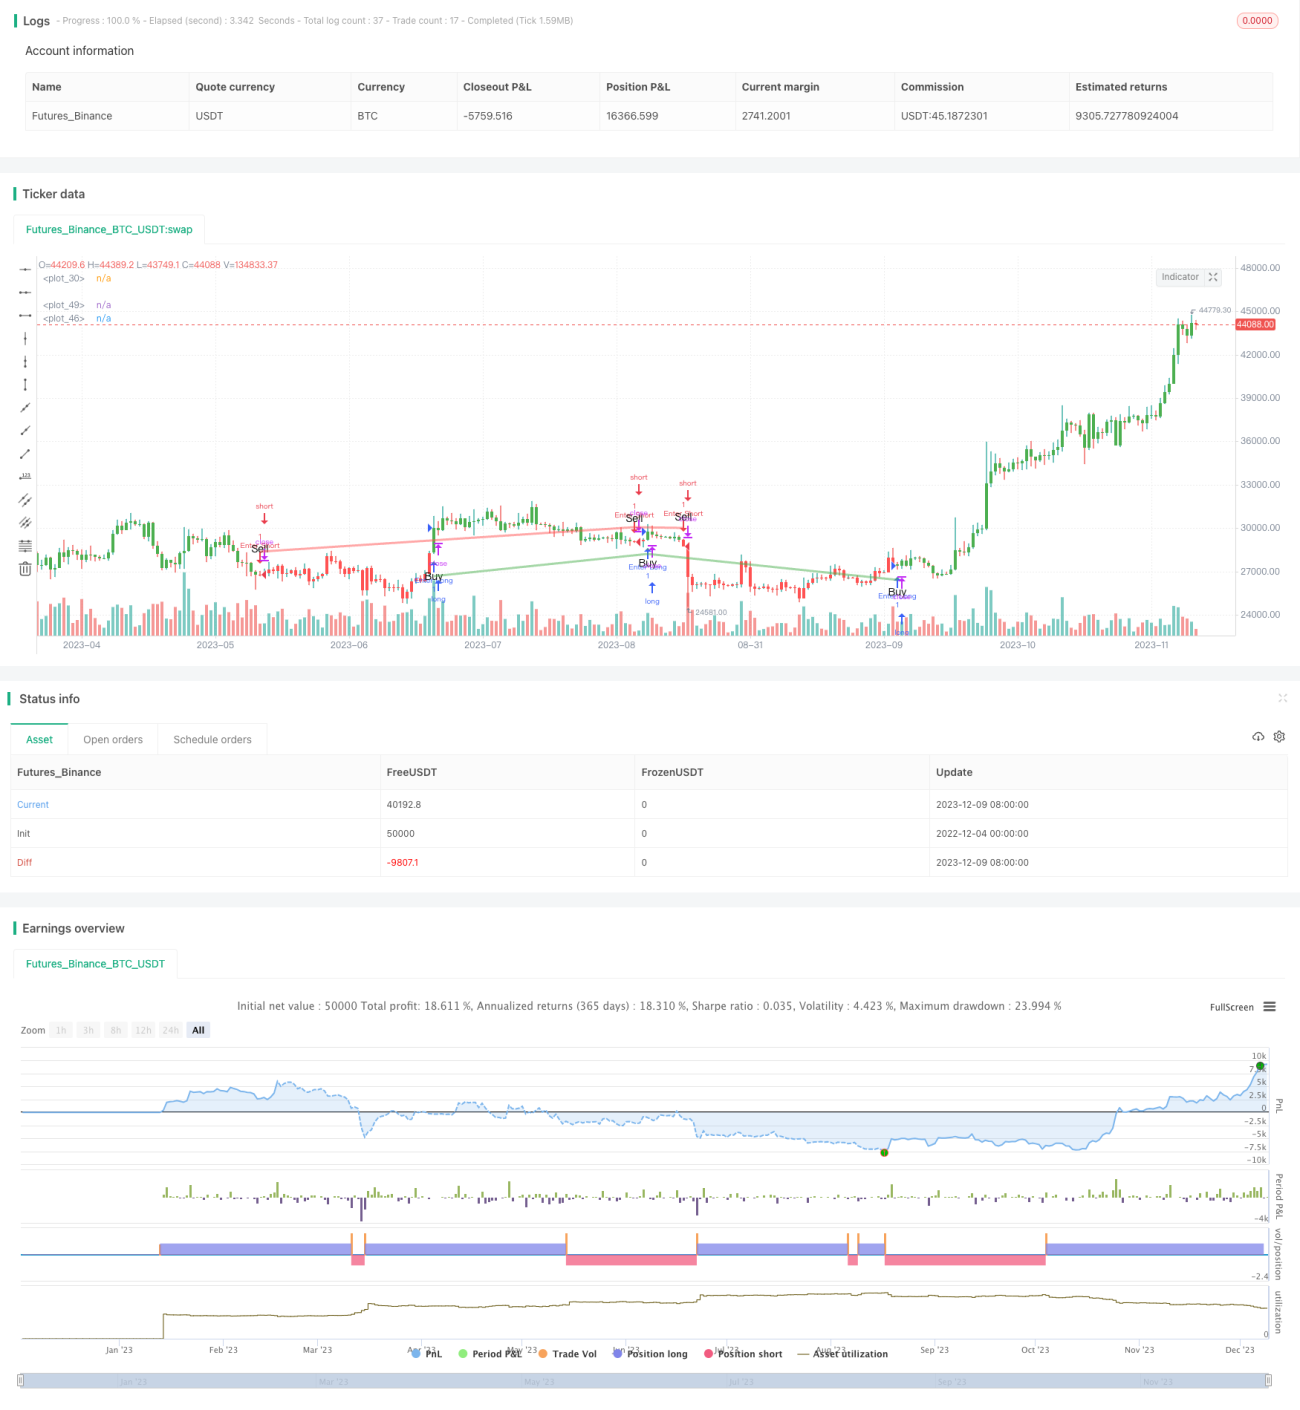
/*backtest
start: 2022-12-04 00:00:00
end: 2023-12-10 00:00:00
period: 1d
basePeriod: 1h
exchanges: [{"eid":"Futures_Binance","currency":"BTC_USDT"}]
*/

// This source code is subject to the terms of the Mozilla Public License 2.0 at https://mozilla.org/MPL/2.0/
// © byee322

/// This strategy uses the EMA to generate buy and sell signals with a 1.5x ATR stop loss- 1