গতিশীল মুভিং এভারেজ দ্বৈত কৌশল

ওভারভিউ
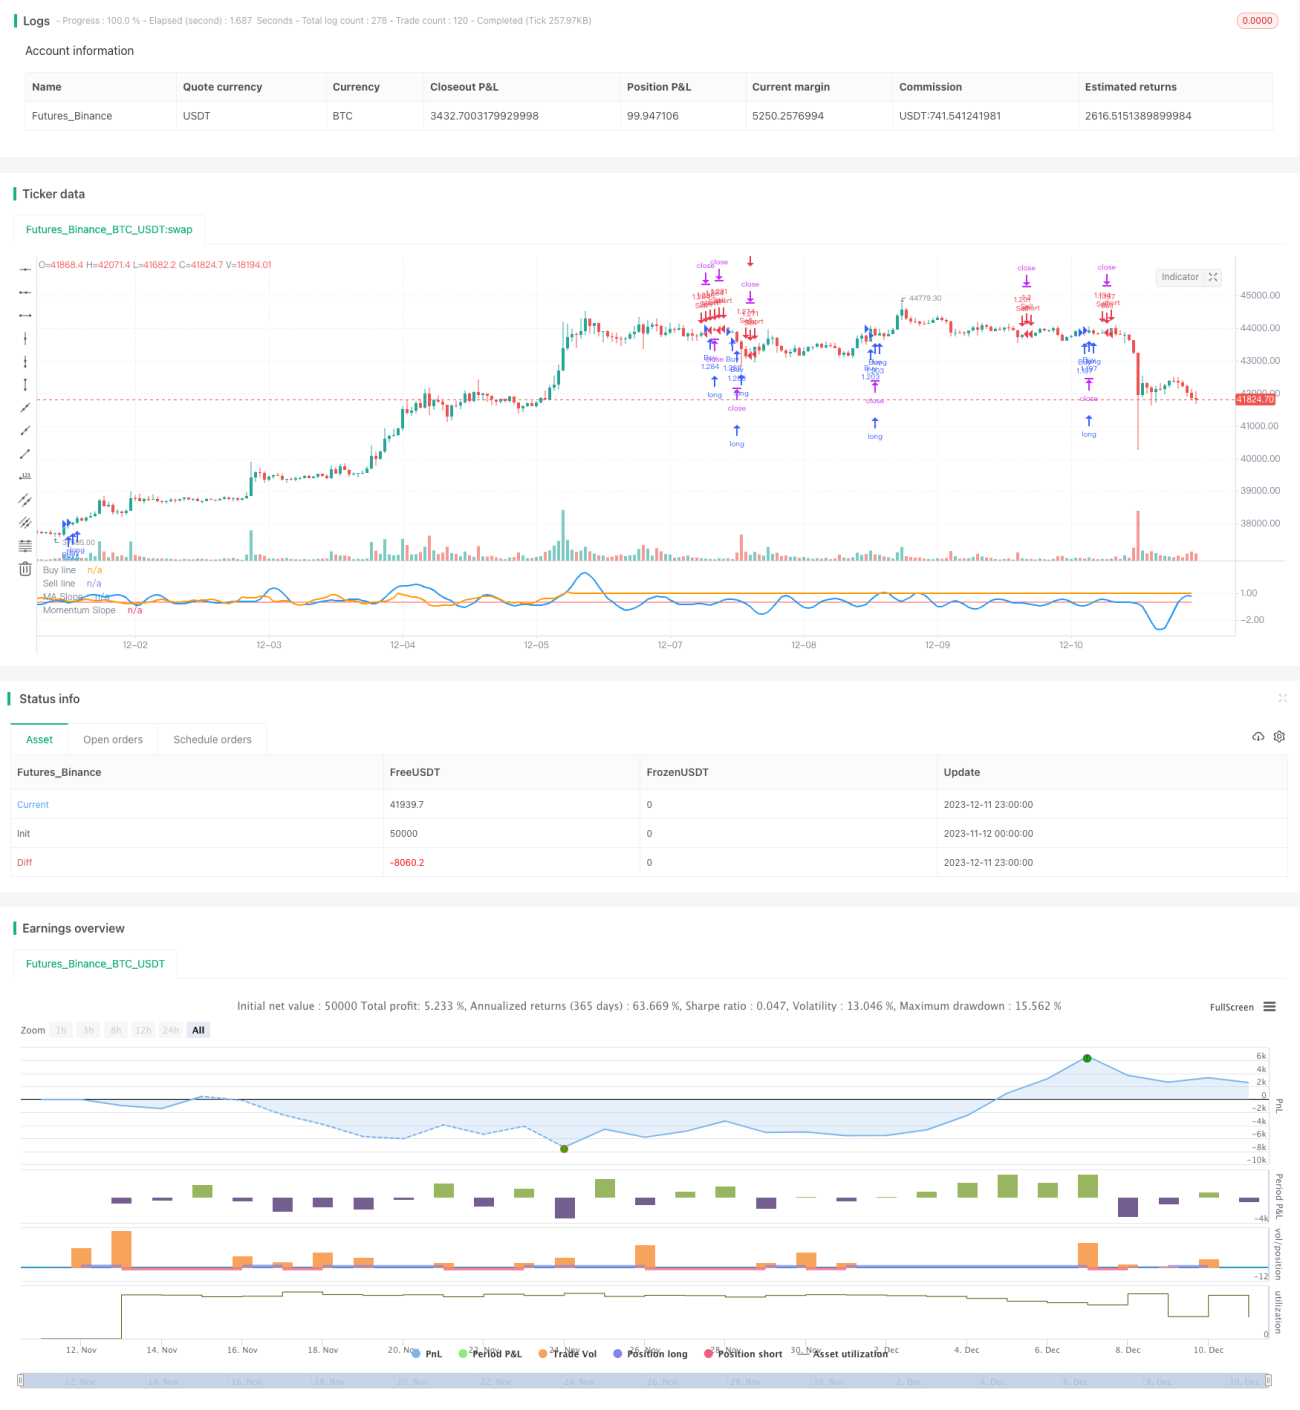
এই কৌশলটি মুভিং এভারেজের (এমএ) এবং ডায়নামিক ইন্ডিকেটরের (এমএ) স্লাইড ব্যবহার করে ট্রেডিংয়ের সিদ্ধান্ত নেয়। এটি এমএ এবং ডায়নামিক স্লাইডের সাথে সেট করা থ্রেশহোল্ডের সাথে তুলনা করে এবং যখন উভয় স্লাইড থ্রেশহোল্ড অতিক্রম করে তখন একটি ট্রেডিং সিগন্যাল উত্পন্ন করে। এই কৌশলটিতে একটি নিম্ন ওভারলিং ফিল্টারও রয়েছে, যখন বাজারের অস্থিরতা কম থাকে তখন বিভিন্ন এমএ উত্পন্ন সংকেত ব্যবহার করে।
কৌশল নীতি
এই কৌশলটির মূল বিষয় হল দুটি স্কেলেন্স কার্ভের তুলনা করা। প্রথমত, এটি MA এবং গতিশীলতার সূচকের স্কেলেন্স গণনা করে। স্কেলেন্সটি কার্ভের গতি এবং দিকের পরিবর্তনকে প্রতিফলিত করে। তারপরে দুটি থ্রেশহোল্ড ব্যবহার করা হয়, যখন উভয় স্কেলেন্স কার্ভের প্রাসঙ্গিক থ্রেশহোল্ড অতিক্রম করে তখন ট্রেডিং সিগন্যাল তৈরি করা হয়।
উদাহরণস্বরূপ, যখন এমএ স্লাইড এবং গতিশীলতা স্লাইড উভয়ই ট্র্যাকের উপরে থাকে, তখন একটি ক্রয় সংকেত উত্পন্ন হয়; যখন উভয় কার্ভ নীচে পড়ে, তখন একটি বিক্রয় সংকেত উত্পন্ন হয়। এটি কিছু মিথ্যা সংকেত ফিল্টার করতে পারে।
নিম্ন ওভারল্যাপ ফিল্টারগুলি বাজারের অস্থিরতা নির্ধারণের জন্য একটি দীর্ঘমেয়াদী এমএ ব্যবহার করে। যখন অস্থিরতা কম থাকে, তখন বিভিন্ন প্যারামিটারগুলির এমএ ব্যবহার করে ট্রেডিং সংকেত তৈরি করা হয়, যা বিভিন্ন বাজারের অবস্থার সাথে খাপ খাইয়ে নেয়।
সামর্থ্য বিশ্লেষণ
এই কৌশলটির কিছু সুবিধা রয়েছেঃ
-
ডাবল ফিল্টার ব্যবহার করে ট্রেডিং সিগন্যাল সেট করা হয়, যা কিছু গোলমাল ফিল্টার করে এবং সিগন্যালের গুণমান উন্নত করে।
-
নিম্ন ওভারল্যাপ ফিল্টারগুলি কৌশলগুলিকে বিভিন্ন বাজারের অবস্থার সাথে খাপ খাইয়ে নিতে সক্ষম করে।
-
বিভিন্ন প্রজাতির জন্য অপ্টিমাইজ করার জন্য বিভিন্ন প্যারামিটারকে অত্যন্ত কাস্টমাইজ করার অনুমতি দেয়।
-
কার্ভ ফিটনেস ফলাফলের উপর প্রভাব হ্রাস করার জন্য একটি পুনরাবৃত্তি-মুক্ত ফাংশন রয়েছে।
ঝুঁকি বিশ্লেষণ
এই কৌশলটির কিছু ঝুঁকিও রয়েছেঃ
-
দ্বৈত ফিল্টারিং কিছু বাস্তব সংকেত ফিল্টার করতে পারে, যা মিস করা সুযোগের কারণ হতে পারে। প্যারামিটারগুলি সামঞ্জস্য করে অপ্টিমাইজ করা যেতে পারে।
-
নিম্ন ওভারল্যাপ ফিল্টারগুলি থ্রেশহোল্ড নির্ধারণের জন্য যত্ন সহকারে পরীক্ষা করা প্রয়োজন। যদি প্যারামিটারগুলি ভুল হয় তবে সংকেত বিচ্যুতি হতে পারে।
-
MA এবং গতির সূচক প্যারামিটার সেটিং নির্দিষ্ট জাতের জন্য অপ্টিমাইজ করা প্রয়োজন, পুরো বাজারের সাধারণ প্যারামিটারগুলি নির্ধারণ করা কঠিন।
-
পুনরাবৃত্তি-বিহীন ফাংশনটি পুনরুদ্ধারের বক্ররেখার সামঞ্জস্যের সমস্যাগুলি সম্পূর্ণরূপে এড়াতে পারে না, এবং শক্ত ডিস্কের কার্যকারিতা এখনও যাচাই করা দরকার।
-
উচ্চতর কাস্টমাইজড প্যারামিটারগুলি প্যারামিটার স্পেসকে জটিল করে তোলে এবং অপ্টিমাইজ করা আরও কঠিন করে তোলে।
অপ্টিমাইজেশান দিক
এই কৌশলটি নিম্নলিখিত দিকগুলি থেকে অপ্টিমাইজ করা যেতে পারেঃ
-
আরো অনেক ধরনের এমএ এবং গতিশীলতার সংমিশ্রণ পরীক্ষা করুন এবং সবচেয়ে উপযুক্ত একটি খুঁজে বের করুন।
-
MA এবং গতির সূচকগুলির দৈর্ঘ্য প্যারামিটারগুলিকে অপ্টিমাইজ করুন, বিলম্ব এবং গোলমালের ভারসাম্য বজায় রাখুন।
-
প্যারামিটারগুলিকে অনুকূলিতকরণ করুন যাতে আপনি আরও স্থিতিশীল সূচকের সমন্বয় খুঁজে পেতে পারেন।
-
নমনীয়তা বাড়াতে বিভিন্ন স্বল্প-অস্থিরতার সূচক এবং প্যারামিটার পরীক্ষা করুন।
-
বিভিন্ন জাতের এবং সময়কালের উপর পরীক্ষা করে, সর্বোত্তম প্রয়োগের জন্য অনুসন্ধান করুন।
-
ম্যানুয়াল অপ্টিমাইজেশনের কাজ কমাতে প্যারামিটারগুলিকে স্বয়ংক্রিয়ভাবে অভিযোজিত করার প্রক্রিয়া তৈরি করুন।
সারসংক্ষেপ
এই কৌশলটি সামগ্রিকভাবে একটি অত্যন্ত নমনীয় এবং কাস্টমাইজযোগ্য ডাবল এমএ কৌশল। এটি মূল্য এবং গতিশীল তথ্যের সাথে একসাথে সিদ্ধান্ত গ্রহণের জন্য কার্যকরভাবে মিথ্যা সংকেতগুলি ফিল্টার করতে পারে। নিম্ন ওভারল্যাপ ফিল্টারগুলি কৌশলটিকে আরও স্থিতিস্থাপক করে তোলে এবং বাজারের পরিবর্তনের সাথে খাপ খাইয়ে নিতে পারে।
প্যারামিটার অপ্টিমাইজেশান এবং সূচক নির্বাচনের উন্নতির মাধ্যমে, এই কৌশলটি রিয়েল এস্টেটে প্রয়োগের জন্য একটি মূল্যবান বিকল্প হতে পারে। এটি এমএ এবং গতিশীল সূচক ব্যবহার করে ট্রেডিং সিদ্ধান্ত নেওয়ার জন্য একটি রেফারেন্স টেমপ্লেট সরবরাহ করে।
/*backtest
start: 2023-11-12 00:00:00
end: 2023-12-12 00:00:00
period: 1h
basePeriod: 15m
exchanges: [{"eid":"Futures_Binance","currency":"BTC_USDT"}]
*/

// This source code is subject to the terms of the Mozilla Public License 2.0 at https://mozilla.org/MPL/2.0/
// © Allenlk
//@version=4
strategy("DRSI DMA Scalping Strategy", shorttitle="DRSIDMA", overlay=false, initial_capital=1000, pyramiding=2, default_qty_type=strategy.percent_of_equity, default_qty_value=100)- 1